Showing posts with label employment. Show all posts

Friday, May 31, 2013

Divergence in employment growth numbers

A few months ago I highlighted how looking at the employment data on a year over year basis provides a different perspective on the numbers.  Today I'd like to bring up a divergence between the private and public data.

yoy employment data and divergence them

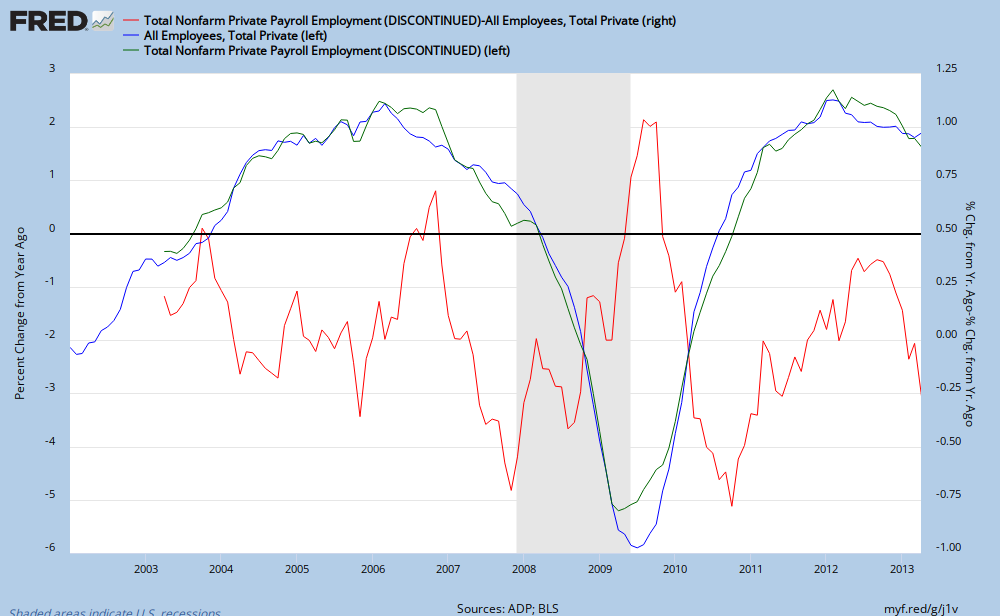
The green and blue lines are the ADP and government year over year employment growth data, left scale and the red jagged line is the difference between their growth rates, right scale.  What's noticeable is the divergence between them.  While it would be better to show just the absolute difference between them regardless of sign, I'm not enough of a FRED graph Meister to figure that out right now.   Right now the >0.35% difference between them is the largest on record for this data series.

Is this divergence truly exceptional? It may have been greater in the past and only later revisions tightened up the spread.

I'm not making a prediction as to which is wrong, merely it's likely the spread will narrow in the future.

Thursday, February 21, 2013

A warning from the unemployment line

The weekly initial claims for unemployment data was released today and it is getting close to being a concern of mine.

Year over year change, initial unemployed claims - Source Federal Reserve
As can be seen from this chart of *non seasonally adjusted and *4 week average of seasonally adjusted data, (the noisiest and smoothest interpretations of this data series) the rate of decline has effectively stopped. Yes there were some spikes upwards during the hurricane Sandy and blizzard Nemo, but the trend has started to move upwards after spending most of 2011 and 2012 fluctuating around an annual decline in jobs  unemployment claims of ~40,000.

We are now near the break-even mark and if it starts to consistently go positive, (more people laid off now as compared to last year) this would be a very strong warning flag to the US economy.

Considering the recent payroll tax hike and other tax increases recently imposed it is possible we may see this happen.

Thursday, January 3, 2013

Employment, seasonality, and noise

The monthly employment report can be a high volatility day for the markets.  The ADP report (BusinessInsider.com) came in above expectations and this was most likely the reason for early weakness in bond prices. (before the Fed Minutes release.)  However how one looks at the data can change your perspective.

Monthly employment numbers, ADP and Federal
Source: Federal Reserve
ADP data is shown in red, with Federal data shown in blue. Looking at the data, it does look quite random, great recession notwithstanding. It jerks up and down with no apparent order and the ADP data does not appear to track the Federal data well.  No wonder the markets can be volatile on employment release days.

Let us look at the data a slightly different way ...
Year over year change in employment, ADP and Federal
Source: Federal Reserve
Same data, just looking at a year over year percentage change instead of an absolute monthly change.  Looks a little different doesn't it?  There are minor variations in the two curves but not much.  Looking at the data this way however, it appears we are on the downslope of employment growth and that great ADP number which was released today doesn't look so impressive does it?

I'm not implying what tomorrow's employment report will look like, just a hint that how you look at the data can make a big difference in what conclusions to draw.

Friday, April 6, 2012

Before you panic about the employment report -- Some context

The monthly employment report was released today and while the economy continues to add jobs the report did not meet expectations.  (As of writing this on Friday afternoon SP500 futures were down 1+% while long term bond futures were up +1.3%)

Here's a longer term chart of the year over year percentage change of total employment as reported by the government and ADP. (ADP is in red)
Employment
Source: Federal Reserve

Employment is still growing but the rate of growth is looking like it may top in the near future.  If in the next couple of months you see these metrics really roll over then I'll be hitting the REAL panic button but right now the slow grind upwards still appears valid.

That being said I'm not suggesting you go out and buy stocks.  If America slows down from our already tepid growth as Europe falls back into recession and China continues to slow the world could be in some serious trouble. (All in all I'm not too enthused about equities right now as they have already had a huge run from late last year.)

Just please keep this chart in mind if the markets are down on Monday and the financial press is in a lather about it all.

Monday, March 12, 2012

Revising employment data

In my last post I promised to look at how employment data is being revised over time. On Friday the latest employment data was released and previous data was revised upwards in both the seasonal and non-seasonal data series. While this graph below shows data from just last months revision I may start showing multiple threads to see how the revisions change over time once we have more data.

I know, not much data to look at yet. Hopefully we'll see something interesting as time progresses. 

Wednesday, February 8, 2012

This post (and employment data) will be revised

The recent employment report has been a great point of contention between the bulls, bears, and the black helicopter crowd. I won't rehash the report but there's something I mentioned in a previous posting about employment seasonality that caught my attention.

The beginning of a new year brings a large number of layoffs as seasonal workers for the holiday shopping rush are released.  As you can see from this first graph the non seasonally adjusted data and adjusted data vary greatly right now.
Total nonfarm payroll 
The difference is rather obvious to see but lets transform the data a bit and look at the difference between the normalized and raw data.


Subtracting one from the other exposes just how much the raw data can vary from the the adjusted data in an attempt to smooth out the seasonality of the data.  As can be seen we are at the peak of this delta and it will most likely be revised in the future due to the fact we are that noisiest point in the data collection period.  Will it be revised up or down? I haven't a clue, but I'm going to watch it and report to you how much these data series change over time.  Stay tuned.

Wednesday, March 10, 2010

Temporary workers increase year over year. Good news or a head fake?

Temporary worker employment has finally turned positive on a year over year basis.  Unfortunately this could be a head fake due to the current census temporary employment surge going on right now.  Fortunately the temporary census workers employment blitz should be over with before the usual seasonal peak in October / November.  If the seasonal peak of 2010 is above that of the previous year we may have a 'positive' bit of news to share with the world.

Friday, January 29, 2010

Temporary Workers -- less worse

I know I know, I'm a bit late in producing this but I've been busy the last few weeks and the usual charts and graphs data feed has fallen to the wayside a bit.

Employment data came out a while ago and the temporary employment subsection showed some improvement in the famous 'second derivative' department. 

Unlike some other people who look at seasonally adjusted data I prefer to look at the non seasonally adjusted series, noise and all. 

December was higher than November, which is unusual.  It could be later hiring for the Christmas rush or the census hiring hitting.  As such the yoy% change was a bit higher than I expected.

 I have added a new line to the graph 'min max average'.  This line is constructed by averaging the max point over the last 14 months and  the minimum data point over the last 14 months.  I use 14 months because the peak and valley for temporary employment can each sometimes vary by a month.  Generally this min max average and the %yoy change confirm each others movements but I thought looking at the data a slightly different way would be interesting.  The min max average continues to drop.

Census hiring is supposed to peak during the summer months and thus hopefully not screw up this data series too much.  Right now it is showing a 'less worse' situation but still NO growth. 

Wednesday, November 25, 2009

Temporary workers -- data from the front lines

Temporary workers are the first to be fired and hired by companies as they attempt to balance demands and costs.  As you can see temporary worker employment is very seasonal, usually peaking around October and quickly falling to a seasonal low around January.

The usual 'spike' in temporary workers did not happen last year and the dropoff in temporary workers this recession is much larger than in 2000-2001.  As such year over year data will be less predictive until we settle into a new normal but on a longer term basis this data set is a good way to sense the pulse of corporate hiring and firing.  How many temporary workers are around in the nadir of 2010 employment sometime in January / February will be the next time we can start to tease out any real information.  I'll keep you informed.