Showing posts with label natural gas. Show all posts

Wednesday, March 9, 2016

US Coal - brutal fallout from low natural gas prices

I've recently posted on the drop in natural gas and oil prices, but I haven't commented much on the knock on effects.  A brutal example is the destruction of coal companies in the US.  Train car loadings of coal have completely fallen off a cliff, caught fire, and remain a smouldering ruin.


Look at some of the stock symbols for coal companies and you'll see declines even more severe. Here's BTU (Peabody Energy)

Low natural gas prices are encouraging a switch from coal to natural gas electricity generation


It is not a good time to be in the coal business

disclosure: No positions, either long or short.


Monday, November 16, 2015

Oil's eventual recovery, part one

Right now we are experiencing something which has only happened twice in nearly 30 years, a greater than 50% year over year drop in the price of oil.  The previous event happened during the great financial panic of 2008 - 2009.  Today the US, China, or Western Europe aren't experiencing a severe recession, so what triggered this dramatic fall?  At it's simplest, supply exceeded demand.  The how and why is fascinating. 

Some quick charts describing the extent of the decline
Year over year percentage change in the price of oil.
Absolute price - Beside the dip to 40 during the great financial crisis, the last time US oil prices flirted with 40 dollars was in 2004.


So what caused the fall?  Note the graph below, showing oil production levels of the largest five producers up to 2014.   US oil production grew 15.9% from 2014 to 2013 (Source: BP statistical review) and not only was this the largest percentage increase in the world, it was also from one of the largest suppliers in the world.  In fact in 2014 the United States pumped more oil than any other country in the entire world. From a nadir in 2005, US production rose nearly 70% by 2014 -- a increase of more than 4.7 million barrels a day.  Additionally total world oil production increased by ~2.3% in 2014.


Demand did not keep pace with supply however. 


Source: yardeni.com

Note the graph above hasn't shown a decline in world crude oil demand since the great recession; instead supply outstripped demand and prices fell.  Saudi Arabia exacerbated the situation by pumping even more oil. (I'll speculate as to WHY later)
Saudi Oil Production

Remember all that talk about Peak Oil so many years ago?  American oil companies evidently didn't read the articles calling for the death of oil production. 
    
Source: Google Trends

The internet keeps track of almost everything now, so make your predictions carefully.


Even the New York Times piled onto this theme; stating Malthus was eventually right and we'd better get used to it (Peak Oil)

While I may appear to be picking on these predictions, and I am (a little) I would rather highlight how hard it is to make predictions, especially long term forecasts.  I will make a few in later missives.  Be careful with those. 


So how did the US reverse the inevitable decline in oil production?  A technique called fracking (aka shale oil or tight oil) altered the cost structure and timing of extracting oil and natural gas from locations previously thought to be uneconomic.  

Below is a quick video and some additional links describing the technique:


Fracking can resonate for some of my readers as an especially dangerous form of petroleum extraction.  The linked video is from an oil company, so they will show the process in a positive light without discussing any of the possible downsides. (Such as waste fluids intruding into water aquifers)  Google any of the terms and you'll find a strident debate regarding the safety of this new technique.   

Regardless of the safety of the process or whether it should be employed at all, fracking and tight oil extraction techniques are currently legal in America and from my reading of the current regulatory climate will remain so.  Even a recent EPA report on fracking provides fodder for both sides:  https://rbnenergy.com/cmon-gimme-good-water-epa-draft-report-on-hydraulic-fracturing  

Fracking allows for the extraction of oil and natural gas from areas previously thought uneconomic.  New wells are  drilled very quickly and productivity in drilling speed and initial flow rates continue to rise.  Specific examples are always illustrative.  (source: http://www.eia.gov/petroleum/drilling/pdf/dpr-full.pdf )


Notice on the upper left image how initial oil flows increased from less than 100 barrels a day to ~800 barrels in the Eagle Ford region (Texas), a greater than x8 increase in productivity!  This has catapulted Eagle Ford production to more than 1.2 million barrels a DAY. On its own the Eagle Ford today would be considered one of the top 20 countries in the world for oil production from nearly nothing in 2010.  Scroll through the linked report above and you'll see comparable increases in both natural gas and oil for other regions of the country.

One can also see the quick drop off in production for both oil and natural gas since the collapse in energy prices.  The rapid decline rate (more on that later) from these new techniques is both a blessing and a curse The game has changed, and OPEC knows it.

This new technology (fracking) has disrupted the oil production regime, creating a new potential avenue of supply not only in America, but the rest of the world.    How this new technology changes energy pricing as well as geopolitics is too much for just one post.  I'll try to dissect the situation later.

Thursday, February 12, 2015

More energy posts


Another dump of energy articles, questions, etc.

Will big oil charge ahead while smaller E&P's face liquidity issues?
http://on.wsj.com/1KsPoya via @liamdenning
The huge energy companies may be able to power through this downfall assuming prices start rising and they can swoop in and gobble up some low priced assets in the wake of the collapse.

Productivity improvements in oil and nat gas production have been very impressive over the last few years so looking at rig counts over a long time period have lost their efficacy.

https://rbnenergy.com/getting-better-all-the-time-productivity-improvements-crude-production-and-moores-law 

Great post on the recent improvements

World versus US oil prices
http://research.stlouisfed.org/fred2/graph/?g=10uD


For a while US (WTI) prices separated quite dramatically from world prices (BRENT) Will this recur in the future?  The spread helped US refiners earn outsized profits.

Will the Keystone pipeline ever get built?
http://seattletimes.com/html/nationworld/2025244144_pipelineeconomicsxml.html

We may see instead a pipeline going east / west in Canada.  The oil must flow!
http://bigstory.ap.org/article/canada-oks-oil-pipeline-pacific-coast

Crude oil shipped via rail has exploded over the last few years.  Will this trend continue?
https://www.aar.org/data-center/rail-traffic-data


Did oil shipments crowd out coal shipments? And will the coal finally get to the power plants?


Another article on floating storage


Thursday, February 5, 2015

Some Questions regarding oil, nat gas, and energy in general


Some questions have been floating about in my head after the great fall in oil prices and their rippling through all the other various forms of energy.  The predictions are few, if any, just a lot of thinking out loud and links. I've been collecting all this in too many separate nooks and crannies and it is time to collate and collect my thoughts and links.

It's not pretty but it gets the data posted an in one spot.  Questions are just questions, don't look for subtext. Hopefully there will be more than one post.

Will re fracking now become more of a thing?  With lower rigs costs and already built in infrastructure will the older fracked fields get a makeover?

http://climateerinvest.blogspot.com/2015/01/oil-its-cheaper-to-refrack-slb-hal-wft.html

Consumers will gain from lower oil prices yet industries related to oil production, distribution, transportation will suffer.  Which will adjust faster? Concentrated pain versus diffused benefit and over what timeframe?

Jim Chanos has some interesting commentary regarding the tension between big oil's economics versus the frackers.

http://www.cnbc.com/id/102343976


Major trading houses are taking advantage of the contango in oil to store it now in supertankers and sell it forward, or perhaps just speculate?  Either way inventories are going up

http://www.wsj.com/articles/worlds-largest-traders-use-offshore-supertankers-to-store-oil-1421689744

According to shipbrokers and analysts, major traders including Vitol SA, Gunvor SA, Trafigura Beheer BV and Koch Supply & Trading Co. Ltd have chartered supertankers capable of storing a combined total of more than 30 million barrels of oil—many of them in the past few weeks.
RBN Energy runs some numbers on the contango trade (02/02/15)
https://rbnenergy.com/skipping-the-crude-contango-the-floating-crude-storage-trade

eia.gov provides some production decline graphs to see what would happen if new production just stopped in the lower 48. My eyes say a falloff from 7 million / year to ~ 5 million by 2016
http://www.eia.gov/todayinenergy/detail.cfm?id=19711


Also discusses backlogs in production.  Would hate to have paid up for a well that's going to be cash flow negative right now ! :(

Global LNG prices converge, upper band crushed by drop in oil prices
http://www.reuters.com/article/2015/01/27/lng-prices-global-idUSL6N0V603620150127


Thursday, November 20, 2014

Weather and Energy - Hurricane free for another year

The continental US made it another year without a hurricane making landfall. (Winter snow storms are another matter!)

How many more years will the US extend this streak before we get slammed by another one? I have no idea, but it will eventually happen.

A lack of past volatility can lull people into a false sense of security and that's when one can lose quite a bit of money (and lives as well as property in this case)

Some are even opining (Washington Post, 2014 October 7) the recent lack of hurricanes creates a dangerous future situation, and there's some credence to that.

The catastrophic bond market is something I've examined over the years as an alternative asset class but haven't invested any capital in this area yet. We've been in a relatively benign environment and pricing for risk has dropped in this area (sound familiar?)  I'd rather wait for a some 'volatility' to re-enter the system before dipping my toe into this area.

http://www.preferredconcepts.com/when-worlds-collide/ examines this a little more

We've been recently lucky with hurricanes. This will eventually end.


Wednesday, June 4, 2014

Natural gas has a very big hole to fill this summer

The Polar Vortex winter dramatically drew down natural gas stocks as the numerous cold fronts worked their way through America.  While a decline is natural gas inventories is expected each year, this year America ended the winter with dramatically less natural gas in inventory.


US Natural Gas inventories - via the US EIA http://ir.eia.gov/ngs/ngs.html

As of the most recent report, inventories are 40.1% below their 5 year average. To graphically show what this means going forward, here's an estimation of how much needs to be injected into storage every day until the maximum fill date date of November 11th.


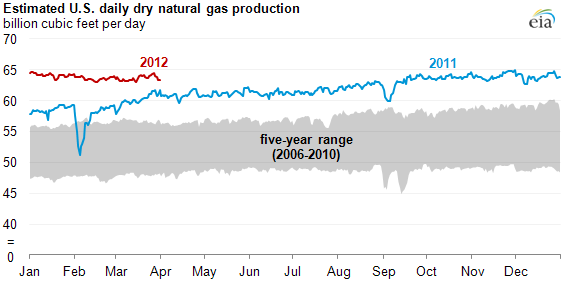
The 2014 line is the one much higher than the rest.  Note how the 2012 line was the lowest, when we experienced extremely low prices.

While it's always a guess as to when we'll hit the maximum in storage each year, (going back 19 years the average date was November 11th with a standard deviation of 9.5 days)  it is quite apparent this year is unlike many others in recent history.  Injecting ~40% more each day looks like a challenge which will not be overcome.  Injection rates depend upon the increased production, weather, industrial activity, hurricanes, and I'm sure a few other factors I have forgotten.

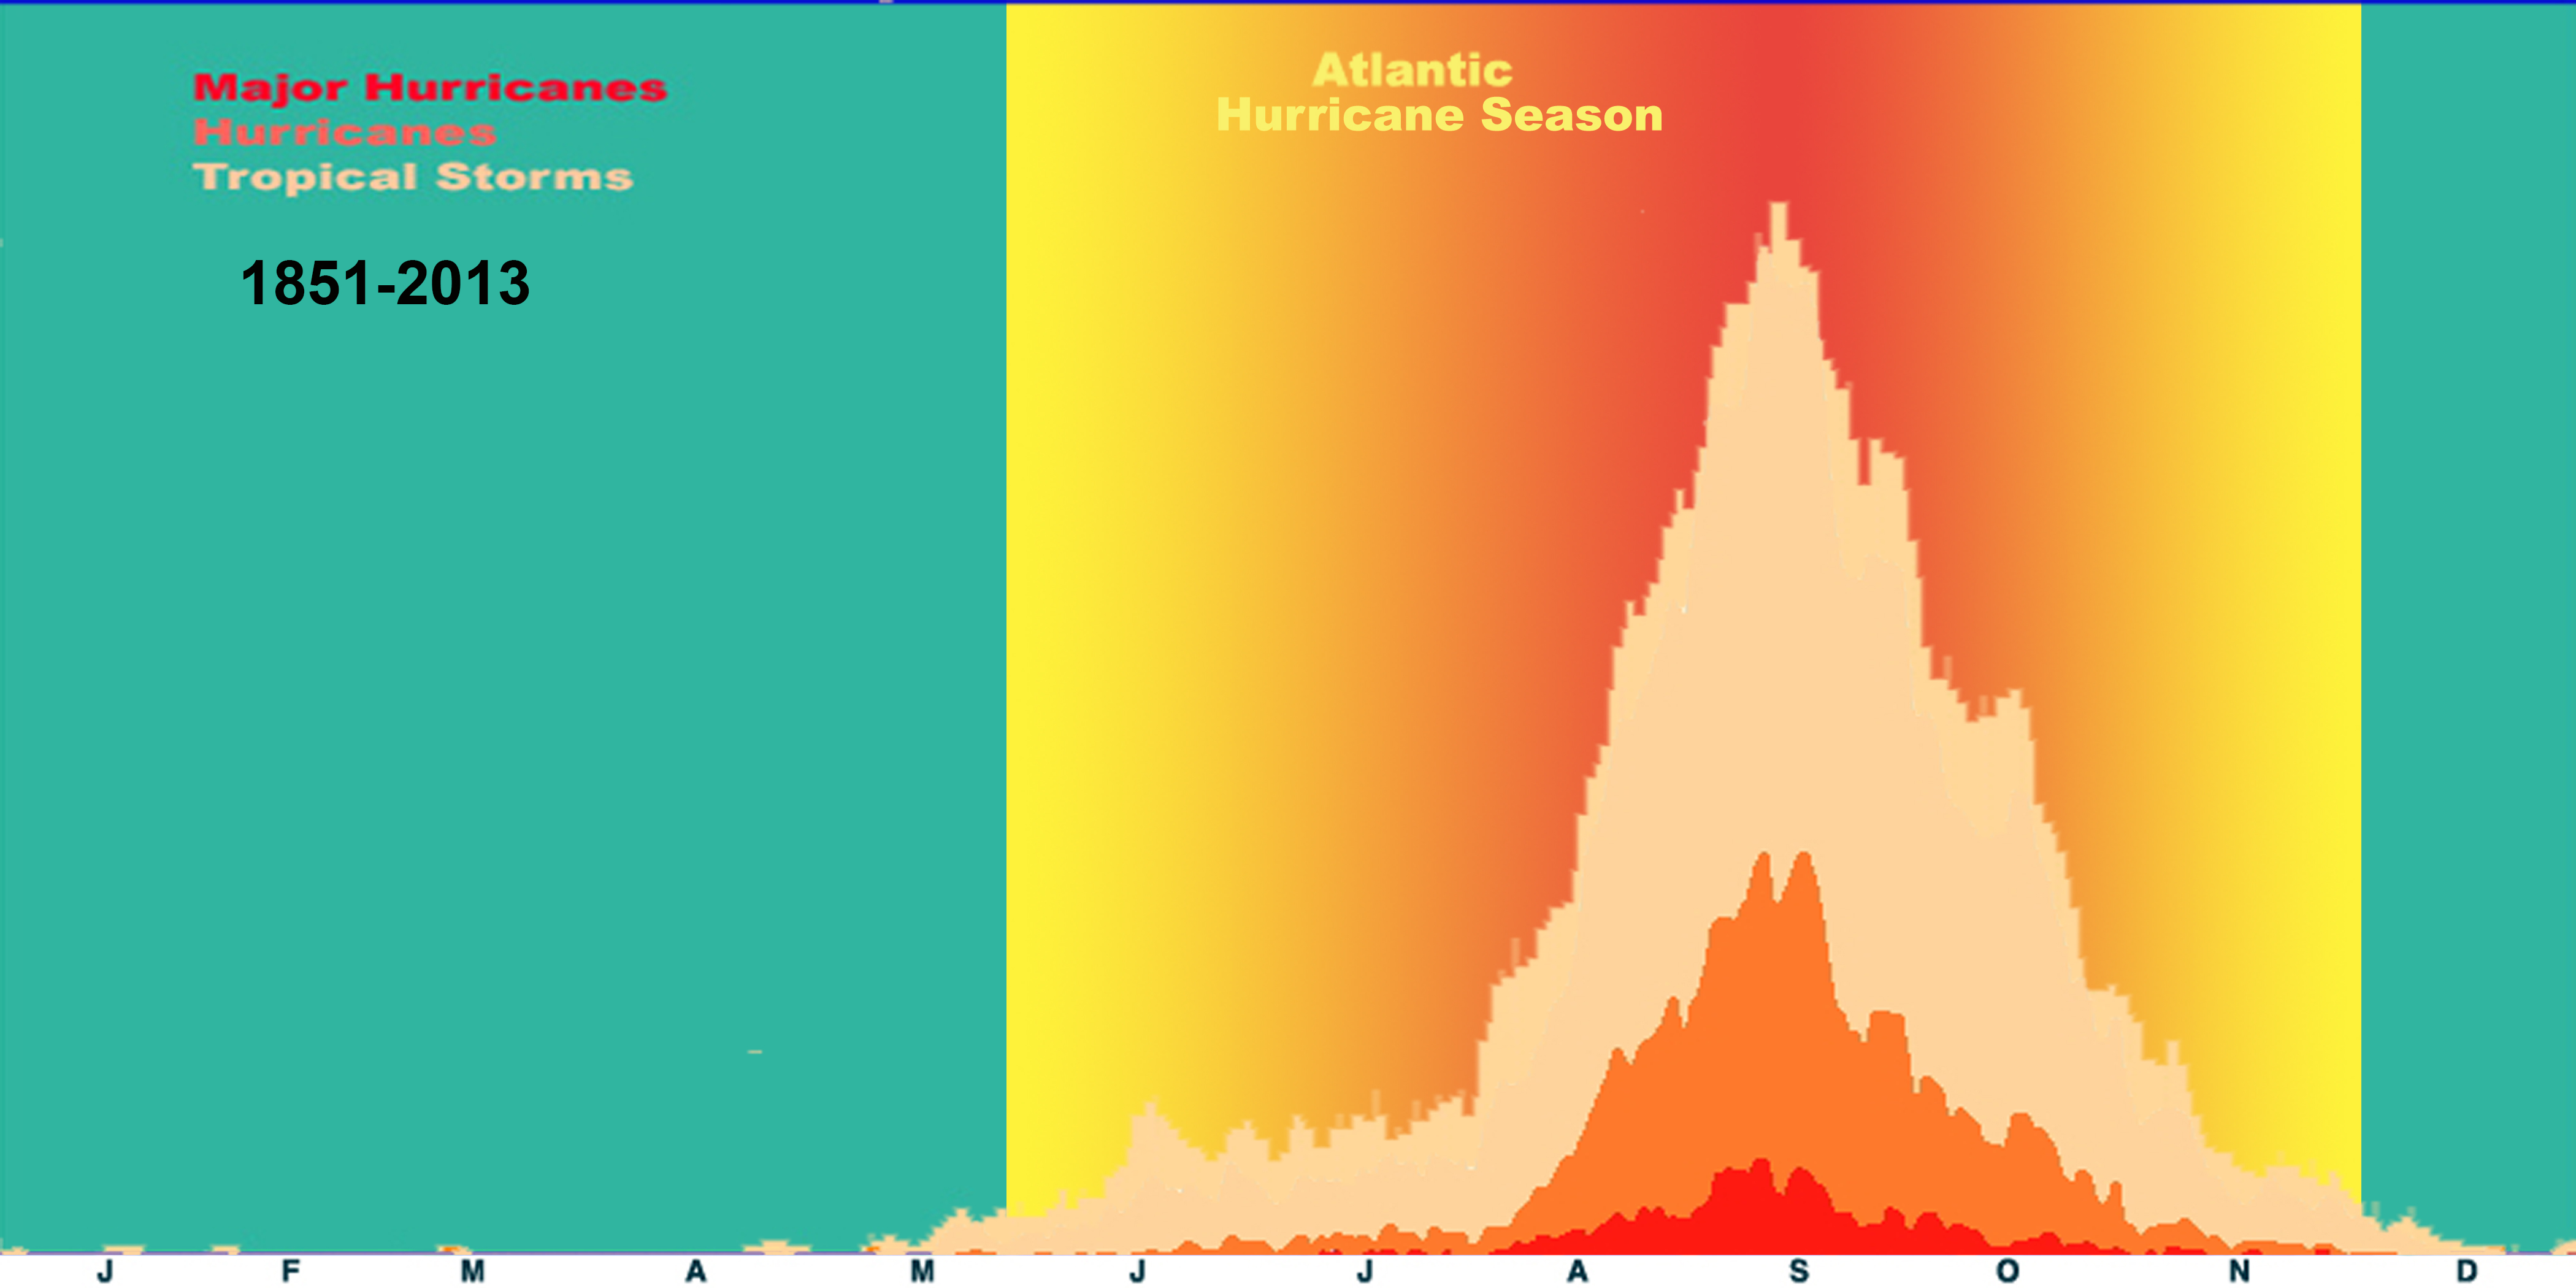
 IF we get a nasty hurricane barreling through the gulf, a hot summer, or an early cold winter we could have some serious inventory problems in early 2015.

I am not attempting to estimate how much natural gas will be in the ground for this coming winter but it is something to watch this summer. 

Friday, June 29, 2012

My natural gas & LNG presentation at 2012 Vail ValueX Conference

Embedded below is my presentation at Vail ValueX on some aspects of the North American natural gas market and how LNG (liquefied natural gas) exports may close the worldwide pricing differential.

Dislaimer: I do discuss some economic winners and losers in this presentation. I own a few of them but I'm not going to tell you which ones.  As an investor you should make your own decisions about what to own and I don't know your risk profile or need for current income, etc.


The topics of natural gas and LNG exports are very large and compressing it down to 15 minutes was a challenge.  I could only present the major factors I see driving price differentials.

The full list of presentations can be found at the Vail ValueX hosts' Scribd site: http://www.scribd.com/VitaliyKatsenelson


ValueXVail 2012 - Greg Merrill

Thursday, May 3, 2012

Natural Gas followup

A few days ago I blogged about natural gas and how we could have problems storing it all. The WSJ recently posted a video on this very topic:


Chesapeake Energy (CHK) would not be in the news as much if the price of natural gas wasn't so low.  Amazing how you only find out about the problems after the crisis occurs.... hmmmm

Considering the drubbing stocks have taken in this sector I am researching this area. These low nat gas prices will not last forever.


Thursday, April 26, 2012

Will we run out of storage for Natural Gas?

The price of natural gas has been falling throughout 2012 and is making multi year lows.  You have to go a long way back to find sub $2 natural gas and considering the price of oil is near nominal highs this is unusual.  (Yes I know there's not of much a substitution effect between NatGas and Oil but work with me here.) 


Natural Gas spot price
source: stockcharts.com
So what's driving this drop in gas prices? Some of it can be attributed to a warmer winter but the development of shale gas and fracking technology has opened up whole new geographic areas which were previously thought to be uneconomic to drill for natural gas and oil. (EIA article on the topic) This has increased production (sorry, but peak natural gas has not occurred yet)


This additional production has increased inventories and driven down prices. How much is impressive when you look at long term natural gas inventory figures.


It appears inventory bottomed around March 9, 2012 at 2369 Bcf (Billion cubic feet) where the recent seasonal minimum is around 1600 Bcf. Over the entire data series natural gas has never bottomed with so much already in storage.  This has hit prices. Hard.

One would presume that with spot prices so low, production would be curtailed and bring the supply and demand back into balance. This may not happen fast enough.  Even with very low spot prices production is still higher than last year. Couple this with already higher than average inventory numbers inventory and you have falling spot prices.


Nat gas production still high
source: EIA
Could we run out of storage for natural gas before the winter drawdown?  It's going to be a race between declining production (if any) compared to already bloated inventory figures.  I quantify the challenge below.  Each yearly line shows the injection rate needed to fill inventories to capacity each year. Consider it a "glide path" of how much you'd need to produce each day until the peak inventory day (around the middle of November) The injection rates are not linear throughout the year but comparing the curves is instructive. As one can see in 2012 the hurdle is very low.


Right now the injection rate for 2012 can be ~33% lower than previous years to completely fill up inventory by the middle of November.  


IF you see the 2012 line continue to drop as time progresses and remain well underneath the 2009 line storage may very will fill up.  We have another 200 or so days to go; I'll be updating you over the summer.

Disclosure: short UNG

Tuesday, July 6, 2010

Late Night Linkage

Some links of stuff I've been reading recently:

http://alephblog.com/2010/07/05/watch-the-state-of-the-states/

Canadian home sales falling.  Prices next?
http://globaleconomicanalysis.blogspot.com/2010/07/vancouver-home-sales-drop-30-percent.html

A different look at Dr. Copper
http://humblestudentofthemarkets.blogspot.com/2010/07/dr-copper-teeters-over-abyss.html

China home prices
http://www.telegraph.co.uk/finance/china-business/7875713/Chinas-property-market-braced-for-30pc-drop.html

Payroll number may take a header next month due to birth death model
http://jessescrossroadscafe.blogspot.com/2010/07/note-to-mish-bls-added-145897-imaginary.html

Greece -- Default now or later? Good reads.
http://www.nakedcapitalism.com/2010/07/greece-is-restructuring-debt-now.html
http://mpettis.com/2010/06/what-might-history-tell-us-about-the-greek-crisis/


Iran discovers large gas fields
http://www.hellenicshippingnews.com/index.php?option=com_content&task=view&id=109332&Itemid=79

More oil found in North Sea
http://www.telegraph.co.uk/finance/newsbysector/energy/oilandgas/7873355/North-Sea-oil-hopes-rise-of-the-biggest-discovery-in-a-decade.html

Libya eyes purchasing stake in BP.  Cue irony.
http://www.telegraph.co.uk/finance/newsbysector/energy/oilandgas/7873702/Libya-eyes-stake-in-bargain-BP.html

China building more nukes
http://www.chinadaily.com.cn/business/2010-07/06/content_10069093.htm

BP considering selling assets to pay fines
http://www.bloomberg.com/news/2010-07-05/bp-said-to-consider-selling-colombia-venezuela-fields-to-pay-spill-costs.html
http://www.telegraph.co.uk/finance/newsbysector/energy/oilandgas/7866766/China-seeks-9bn-of-BP-assets-in-Argentina.html


Ozzie mine tax revised
http://seekingalpha.com/article/212933-miners-win-as-australian-government-revises-mining-tax

ECRI predicts more frequent recessions in future
http://www.businesscycle.com/news/press/1887/

Steven Keen gets some more press on his Minsky model predicting what will happen next.
http://www.nakedcapitalism.com/2010/07/steve-keens-scary-minsky-model.html

http://www.creditwritedowns.com/2010/07/mandelbrot-fractals-and-the-art-of-roughness.html

Recent jobs report was not good
http://www.thereformedbroker.com/2010/07/03/the-truth-about-those-job-numbers

Monday, January 4, 2010

Philip Verleger on Oil, Natural gas, the Saudi perspecitve and more

A 30+ minute podcast of Philip Verleger interviewed on Bloomberg Radio.  (click the little play button next to the date)  A good overview of the oil, natural gas markets, the Saudis, and more.  He touches on the current use of tankers for oil storage, Exxon's purchase of  XTO, trade balances and the Chinese.

I have been following Mr. Verleger for a while and it is refreshing to hear an analyst say he was wrong.  Predicting the future prices of assets is always very tricky but he at least admits it.  He does reinforce that the inbalances causing him to predict low oil prices in 2009 are still there and do not appear to be abating.

Friday, October 23, 2009

Fuel Substitution between energy types

I was reading this article from Sober Look blog a few weeks ago and thought I'd investigate further into the ability to switch fuels from coal, natural gas and oil for electricity generation.  To quote:
Fuel switching is actually quite common at power plants, the biggest users of natural gas. Many modern power plants can switch between gas and fuel oil, and many can switch to coal as well.

In fact cheap natural gas has created an oversupply of coal as well.
EIA: A generating unit capable of burning more than one fossil fuel is referred to as a dual-fired unit. Some dual-fired units can only burn one fuel at a time (that is, the fuels are fired sequentially), while others can burn more than one fuel simultaneously (concurrent firing of different fuels). A sequentially fired unit generally uses one fossil fuel as its primary energy source, but can switch to a second fossil fuel as an alternate energy source.

I perused the Energy Information Adminstrations web site and found some confirmational data. 

Here's the year to date (through July 2009) energy production from various sources

Coal  -13.1%
Natural Gas +1.7%
Petroleum Liquids -8.6%

It is apparent natural gas production has been favored in the US over coal and petroleum based products this year due to the low price of natural gas. Considering the continued drop of natural gas prices I would conclude the share of production from natural gas will increase for the year.
 
Additional data can be found at the EIA website showing total electricity production as well as products consumed.


Electricity production from coal is down and as you can see from the chart, coal inventories are up. (EIA source)

I understood the possibility of fuel switching from a petroleum based product to natural gas, but had always assumed natural gas has always been cheaper to run than petroleum.  So why run petroleum at all?  I'm concluding the petroleum only power plants are older, more expensive and only run when electricity demands outstrips supply from cheaper sources such as coal, natural gas, nuclear, etc.

This is where the mindset of contstant growth can trip you up.  Total electricity production in the US is down so far for 2009.  In that situation, the first power plants to be shut down would be the most expensive, the oil based power systems.   

When electricity demand returns and the less expensive natural gas and coal based power generators are running at full capacity, only then will more expensive additional oil generators will be turned on. 

Sources:
http://www.eia.doe.gov/cneaf/electricity/epm/table1_1.html

http://www.eia.doe.gov/cneaf/electricity/epm/epm_sum.html