The price of natural gas has been falling throughout 2012 and is making multi year lows. You have to go a long way back to find sub $2 natural gas and considering the price of oil is near nominal highs this is
unusual. (Yes I know there's not of much a substitution effect between NatGas and Oil but work with me here.)
So what's driving this drop in gas prices? Some of it can be attributed to a warmer winter but the development of shale gas and fracking technology has opened up whole new geographic areas which were previously thought to be uneconomic to drill for natural gas and oil.
(EIA article on the topic) This has increased production
(sorry, but peak natural gas has not occurred yet)
This additional production has increased inventories and driven down prices. How much is impressive when you look at long term natural gas inventory figures.
It appears inventory bottomed around March 9, 2012 at 2369 Bcf (Billion cubic feet) where the recent seasonal minimum is around 1600 Bcf. Over the entire data series natural gas has never bottomed with so much already in storage. This has hit prices. Hard.
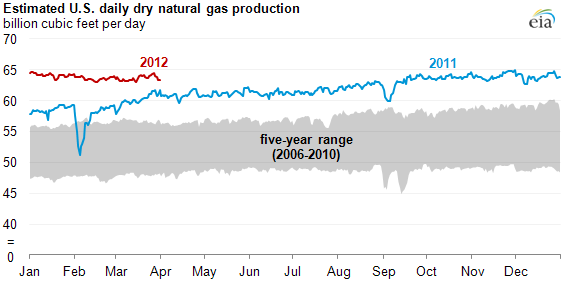
One would presume that with spot prices so low, production would be curtailed and bring the supply and demand back into balance. This may not happen fast enough. Even with very low spot prices production is still higher than last year. Couple this with already higher than average inventory numbers inventory and you have falling spot prices.
 |
Nat gas production still high
source: EIA |
Could we run out of storage for natural gas before the winter drawdown? It's going to be a race between declining production (if any) compared to already bloated inventory figures. I quantify the challenge below. Each yearly line shows the injection rate needed to fill inventories to capacity each year. Consider it a "glide path" of how much you'd need to produce each day until the peak inventory day (around the middle of November) The injection rates are not linear throughout the year but comparing the curves is instructive. As one can see in 2012 the hurdle is very low.
Right now the injection rate for 2012 can be ~33% lower than previous years to completely fill up inventory by the middle of November.
IF you see the 2012 line continue to drop as time progresses
and remain well underneath the 2009 line storage
may very will fill up. We have another 200 or so days to go; I'll be updating you over the summer.
Disclosure: short UNG

.jpg)


This comment has been removed by a blog administrator.
ReplyDelete