Showing posts with label deflation. Show all posts

Friday, October 12, 2012

Inflation expectations and QE(infinity)

I have posted before regarding inflation expectations in the US treasury market and I need to give you an update, especially so considering the recent round of QE as announced by the Federal Reserve.

A refreshed chart from the Fed of the inflation expectation spread (10 year nominal yield minus 10 year TIPS yield) teases out some interesting items to consider.

10 year nominal Treasuries minus 10 year TIPS (source: Federal Reserve

Note how we have recently broke above the 2.5%  Since the GFC it has rarely breached this mark and did not stay there for long.

Now look at when previous QE's were initiated. A graph by dshort.com does the job.


While they are not to the same scale, you will notice the first round of QE was initiated during the deep dark days of the financial crisis.  The inflation expectation spread was near its low of the series and the world looked bleak.

QE2 was discussed mid 2010 and also coincided with an interim dip in the inflation spread at around 1.5%

QE(infinity) was just announced and our inflation expectation spread is already near the highs of the entire series.  

While the Fed and other market participants have their own flavor of inflation expectations they look at this series is near its highs. Before the GFC this spread didn't venture much higher and the Fed thinks they can get it higher now? The future is subject to change (of course) but unless we get some serious wage growth it appears to me the Fed is pushing up against a long term inflation expectation wall.  

As an example here's nominal Personal Consumption Expenditures.  It has been on a secular decline since the inflation days of the 80's and also notice how it recently peaked and appears to be rolling over again (ahem)

Nominal PCE - Source Federal Reserve


For some additional context here's the 10 year nominal and TIPS yield since 2004. Notice how now 10 year TIPS are now going for a negative real yield.


Disclosure: Considering selling/shortening duration on some TIPS positions

Thursday, November 17, 2011

Inflation expectations in the bond market

Here's an update on inflation expectations as expressed by the bond market.   As the nominal 10 year yield continues to drop it has pushed the TIPS real yield to nearly zero.  Some investors may grouse at the option of buying a security that guarantees a zero real return for the next 10 years and I agree with their sentiments. 


As to why this situation exists I would suggest it is a result of the Fed's desire to reflate the economy by numerous unconventional means (zero short rates, all the various flavors of QE)  


The spread between nominal and real yields has remains remarkably stable near the 2% mark with some noise on either side.   If we have another financial crisis, this time in Europe, I wonder if we'll see another drop in the implied breakeven rate....

Thursday, April 14, 2011

Inflation expectations in the bond market

Here's an update on inflation expectations as expressed by the bond market.   While much is being said right now about inflation expectations becoming unglued the 10 year [Treasury - TIP] difference is not showing anything exceptional yet.   As you can see from the chart inflation expectations (as expressed by nominal yields - 'real' TIPS yields) are getting back to their 'normal' range of around 2.5 percent.

10 year TIP yields are near the low end of the range but some of that is due to nominal yields slowly dropping over time, pushing the TIPS yields down so the difference remains relatively constant.  With QE2 slated to end and oil prices (as well as other base commodities) rising it will be interesting to see if the implied breakeven inflation rate rises above long term resistance of ~2.6 percent.

Thursday, December 9, 2010

Inflation update

With the recent rise in interest rates I thought revisiting inflation rates would be helpful.

3 data series on this graph [click to enlarge]:
Blue for total Consumer Price Index (CPI) aka 'inflation'
Red for inflation minus (food and energy)
Green for housing subset

Notice how overall inflation tends to peak at the onset of a recession.
Headline inflation is still very low overall at near 1%
Housing inflation is still negative.
Inflation less food and energy is at a low for this timeline and is trending down.  Yes, we all need to eat and consume energy but both of those items are extremely volatile and stripping them out of the data series can provide additional useful information.

China comes to mind when people speak about energy and food inflation and like almost every other basic commodity the Middle Kingdom overshadows other negative factors such as Europe's continuing austerity drive and our own tepid domestic growth.  To me it appears whichever way China goes the energy, food, metals, etc. complex will follow.

Tuesday, October 12, 2010

Inflation expectations

The recent rumors of an imminent second round of quantitative easing (QE 2.0) by the US Federal Reserve has sent ripples throughout the entire financial market.  One series I occasionally check in on is the implied breakeven inflation rate by looking at nominal versus inflation protected rates in the treasury market.    The threat of QE 2.0 can be seen here as well.


10 year inflation protected rates (TIPS) have fallen to levels not seen for this entire data series.  In other words people are bidding up the value of inflation protection.    However in the context of comparing TIPS rates to nominal the spread is trending downwards but is not out of the ordinary. 

Interesting. 
Of course the Fed threatening to buy up outstanding T bonds (instead of just buying more at auction) also creates a supply demand issue but this trending divergence bears watching.

Wednesday, July 21, 2010

Inflation watch -- Headline inflation rolling over.

Inflation data was released recently.  The headline rate of inflation continues to roll downwards towards zero as the chart shows.  (Source: Federal Reserve)  With oil prices no longer going higher it is likely the headline inflation rate will continue declining.  'Core' inflation (red line)  has been stuck at 1% for the last few months but the longer term trend looks downwards to me as well.  The housing component is stuck in negative territory.

Overall the trend is down for all the sub components of inflation. 

Wednesday, June 30, 2010

No one is talking much about deflation . . . yet.

US Treasury rates have dropped recently and it appears to me they may continue declining.   How low can they go?  I have no idea but I thought it would be interesting to look at when 'deflation' was a popular search term on Google.  Click on the screen capture at the right and you'll see searches spiked around the same time long term US Treasury bond yields dropped very quickly.

I wonder if we'll get another spike in search traffic for deflation if bond yields fall again . . .

Thursday, June 24, 2010

Hugh Hendry takes on . . . . Everyone

Mr. Hugh Hendry is always fun to watch and even more so in this interview:


He discusses the euro, china, George Soros and the 'axis of financial evil'. 

ht: Zerohedge

Thursday, May 27, 2010

Money Money + Money -- Money supply update

Money supply figures supplied by the Federal Reserve (as of 2010-05-27) continue to decline.  The data shown is the sum of M2 and Institutional Money Market Funds (the only subset of M3 still reported)  As you can see money supply tends to drop during / after recessions and recovers as economic activity increases.  We are in uncharted territory as this data set has not shown negative growth for the entire data series.

Considering the growth rate is decidedly negative and shows no inclination of slowing down this is worrisome for future economic growth. 

Wednesday, May 12, 2010

Austerity in Europe, it's so fashionable right now!

As I mentioned recently the austerity would be coming with the bailout packages.  It didn't take even a week and the cutbacks have already started.

Today - Telegraph
Premier Jose Luis Zapatero told a stunned nation that public sector pay will be reduced by 5pc this year and frozen in 2011. "We must make an extraordinary effort," he said.

Pension rises will be shelved. The country’s €2,500 baby bonus will be cancelled. Aid to the regions will be slashed and infrastructure projects will be put on ice. Mr Zapatero’s own monthly pay will fall 15pc to €6,515.


more from the Telegraph today in another article
Jose Luis Rodriguez Zapatero, the prime minister, on Wednesday outlined a series of measures that will include a suspension in automatic increases to retirement pensions, a drop in overseas aid and a reduction in government investment.
He said 13,000 civil service jobs would be cut in 2010, with public sector wages frozen in 2011.


Spanish citizens will not be too happy about this and the austerity packages will tilt yet another country towards recession.

Monday, May 10, 2010

We're from the IMF and we are here to help you.

Before the PIIGS (Portugal, Italy, Ireland, Greece, Spain) of Europe breathe a deep sigh of relief as their funding problems are 'fixed' there's a few items to mention:

Assuming the money arrives you still have to deal with the IMF which has a usual gameplan of:

  • Devalue the currency
  • Raise taxes
  • Cut government spending
Item 1 is out the door as countries use the Euro
Raising taxes and cutting government spending is not a mix that encourages GDP growth.  Consider that when making your investments.   Don't forget that during this period of IMF induced austerity debt / GDP levels will continue to rise.  This is the mother of all 'kicking the cans down the road'.

The wad of money (nearly a $US Trillion!) will be used to allow countries to roll their debts, not stimulus.  The French banks are breathing a deep sigh of relief right now.  Everyone else should rethink what this all means.

Here's a video with my favorite hedge fund agitator explaining the situation.  This interview occured before the announcement but it still holds true.


(ht Zerohedge)

Wednesday, April 21, 2010

Money Money + Money --> Money supply update


Money supply figures continue their decline on an abolute and/or relative basis depending upon how you measure it.  M2 + Institutional Money Market Funds (the only series left from M3) continues declining on a year over year basis, M2 on its own continues to decelerate.  Once the MBS purchases by the Fed finally settle I think the first derivative will continue to decline on both series.

Friday, April 16, 2010

Some Friday Links -- Fun for all. A physics lesson tossed in as well.

Been busy with tax day but here's some links and comments . . .

Greece 10 year bond yields keep rising and are very close to piercing pre bailout yields. 
Some German profs are preparing a lawsuit.  -- Telegraph.co.uk
Has Greece hit the Chandrasekhar limit and just doesn't know it yet?  Once you go passed the limit there is no turning back.

Some back and forth on strategic defaults fueling consumer spending:
Pro Tinfoil: Creditwritedowns
Anti Tinfoil: The Big Picture

Creditwritedowns pulls together a lot of subjects and puts a nice bow on top describing a theory I agree with:  We are in a balance sheet recession that will not produce a strong rebound and will take a long time to reconcile.  I posted the Koo and Chanos videos recently but Mr. Harrison does more work tying it all together. 

Total copper inventories have now risen for 2 weeks straight and are close to penetrating their recent peak level; LME inventories have dramatically slowed their decline and Shanghai inventories hit new highs today.  Copper's getting smacked today.  I'll write more about this soon(tm).

Thursday, April 15, 2010

Inflation update - - The slow slide continues

Inflation numbers were just released and continue to show the slow slide downwards in core CPI numbers.    I modified the chart to highlight core CPI.  As you can see it is still trending downwards along with the housing subcomponent. 

Core CPI touched the 1% yoy level in 2004.  Considering the direction of core CPI we may penetrate that lower level soon(tm)

Housing CPI is still deflating and I don't see that changing anytime soon.

While headline CPI is still higher than core I don't foresee it rising too much more without putting a serious dent in the economy.  $150 oil helped knock the economy over last time and if oil prices continue to rise it will start to crimp the economy again.

Tuesday, April 13, 2010

A veteran's view on short term interest rates pinned at zero

While I disagree with Mr. Koo's prescription for getting out of Japan's mess (more stimulus) his battlefield view of what happened and why Japan is going on 20+ years of malaise should not be discounted:


(ht: Pragmatic Captialist)

Wednesday, April 7, 2010

Watching the Greek tragedy -- 10 year Greek bond rates

The Greek Tragedy is not over, even with 'assurances' by the EU and IMF they stand ready to help.  If you'd like a front row seat to events and watch what everyone else is watching I suggest you keep an eye on 10 Greek bond yields.  While yields spiked and fell back earlier this year they have begun creeping upwards.  If they continue upwards this will eventually precipitate another risk-off selloff in the markets.

The recent debt auctions by Greece have been met with lower bid / cover ratios and lower foreign participation. 

Non-domestic investors accounted for 80 percent of purchases of the first bond in January, 77 percent of the second, and 57 percent of the third. Reuters
While the Greek issue has slid back off the front burner it has not been resolved.  Abrose Evans-Pritchard has an interesting blog post about this very issue recently and his conversation with Carmen Reinhart regarding the slow motion trainwreck that is Greece:

But I digress. Professor Reinhart said Greece cannot hope to escape from its debt trap under the current EU austerity plan. The cure of devaluation is blocked by EMU membership. The restrictive monetary policy of the European Central Bank — a contraction of both M3 money and lending to firms, record low core inflation — must inevitably unleash deflationary forces in Club Med states already trapped in credit busts.
A country can in theory deflate its way back to competitiveness by an `internal devaluation’, ie relative wage cuts, in this case by 20pc to 25pc . . .
On a parting note, Professor Reinhart says the only budget deficit that matters in a crisis is the “cash deficit”, and this reached 16pc of GDP in Greece last year — not the 12.7pc officially registered under “accrual” accounting.
As countries near default, they typically find all kinds of way to disguise their troubles, by shifting debts between government agencies and delaying payments.
“In the end, everything comes out of the woodwork. You realize that it is even worse than you thought,” she said.
Greece is seriously behind the 8 ball and faces tough choices with no easy solution.  They can either drastically cut spending and face a severe recession, accept IMF/EU austerity and lending support, or even default and leave the Euro. I think the last option is least likely but I'm not making any bets for a positive outcome regardless of what happens.

Carmen Reinhart has a recent  interesting paper regarding country growth rates declining as debt/GDP levels rise.  I am currently reading the book she co wrote - This Time is Different and the paper is an excellent primer to the detailed description in the book. Read the paper and then consider buying the book.

The pragmatic capitalist also has some video by MIT professor Simon Johnson about the Greeks.

The locals are also fleeing the Greek financial system.  From the Telegraph:  (ht Zerohedge)

More than €3bn (£2.6bn) of deposits held by Greek households and companies left the country in February, while in January about €5bn of deposits were moved out, according to the latest figures available from the Bank of Greece.

Switzerland, the UK and Cyprus have been the largest recipients of the money, with the wealthiest Greeks looking to move their deposits to Swiss banks accounts to escape the more punitive tax measures many fear will be introduced in the wake of the country's economic crisis.

It's never good when the locals start pulling money out of the banks. . . .

Thursday, March 18, 2010

Inflation expectations and the Treasury market

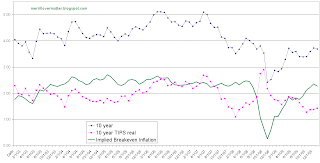
Here's your TIP / Treasury market update.  Nothing extraordinary has happened in the Treasury / TIP market in the last few months.  As mentioned in my last entry the easy money has been made and now it is a lot harder (Tips v. nominals)

One item of note is the real TIPS yield is still relatively low as compared to the history of this data series with the last entry being a 1.42% real yield.  Not very exciting, eh?  The 10 year breakeven inflation rate is effectively where it was two years ago before the Financial panic hit (2.27%) 

Monday, March 1, 2010

Inflation update

Inflation numbers came out a little while ago and it continues to show a decline in overall inflation rates excepting the volatile food and energy segment.   All the data shown is year over year, non seasonally adjusted.  
Core CPI inflation (line in Red) continues a slow decline.  CPI Housing (line in Green) remains stuck at below zero and will most likely remain there for a while.  The Wall Street Journal has some more detail on the data.

For all of you looking for inflation, where is it?  Money supply is falling (I'll post about that soon(tm) ), credit is contracting, the dollar is getting stronger, and inflation is falling.  Longer term I concede it is possible but over the next 12 months I don't see it.

Friday, February 26, 2010

Hugh Hendry on China's chronic overcapacity and what it means.

Hugh Hendry once again nails it (in my opinion) as to what China's conversion into the workshop of the world really means.

This appetite for cheap Chinese exports, which had at one point seemed insatiable, means that we in the West have come to owe our largest Asian trading partner quite a hefty sum of money. China has become the world's biggest creditor, after amassing nearly $2.3 trillion of foreign exchange claims on us. However, the spectre of a creditor nation running persistent trade surpluses has ominous historical portents. It has happened only twice before, with the US economy in the Twenties and with the Japanese economy in the Eighties.
Read the entire article, it is not long.

Monday, January 25, 2010

Inflation expectations in the Treasury market


Relative to nominal treasuries, TIPS were a raging buy at the beginning of 2009 (I bought some then for income clients) Since then the ratio has begun to close in on its apparant long term average around 2.50 (eyeball average)

Note how steady the implied breakeven rate has been since ~2003 excepting the crisis of late 2008 - early 2009.   With the current great debate raging between the inflationists and deflationists it is interesting to now how much this indicator has not moved, and is actually returning to a long run average.