Showing posts with label debt. Show all posts

Thursday, September 28, 2023

So when will the Chinese debt bubble burst?

So when will the Chinese debt bubble burst?

I've yammered on about this for a long long time. Highlighting empty cities to nowhere, excessive debt buildup, etc. Obviously the Chinese government's ability to extend this bubble is greater than my FinTwit credibility.

Are we hitting another decision point? Will the next US recession finally detonate the bubble? Honestly I don't know, but now ever Peter Zeihan is commenting on this.


https://www.youtube.com/watch?v=PVMlEiewyT4


The more China blows the debt bubble the larger the explosion when it pops and right now they are working on exceeding the Japanese bubble from decades ago.

Source: Federal Reserve


No one wants to be blamed for ending the party but eventually it does.  I can't tell you when it will go off, but be careful when it does.

Monday, December 31, 2012

The fiscal cliff of 1937

With all the current noise regarding the 'fiscal cliff' I thought a look back at when we had a real fiscal cliff would be interesting.

Steve Keen, an Australian economist I've mentioned before recently gave a presentation to members of Congress regarding the Fiscal Cliff of 1937.


Source: http://www.debtdeflation.com/blogs/2012/12/06/briefing-for-congress-on-the-fiscal-cliff-lessons-from-the-1930s/

In his presentation Mr. Keen describes the mechanism through which a dramatic tax increase coupled with an absolute cut in spending threw the US economy into a recession.  From 1937 to '38 tax receipts when up ~25% and spending was cut ~8%  While in the 1937 spending and taxes were a much smaller percentage of GDP, the large swings in their absolute numbers were enough to decrease the deficit from -2.5% to -0.1% or a change of 2.4% (source: White House)

Additionally the Federal Reserve shrank their balance sheet at the same time:

The wrong time to anti-QE
Source: Federal Reserve

The combination of Fiscal and Monetary tightening pushed the economy back into recession. (Vertical gray lines on above graph.)

Right now we are experiencing a similar situation: The US economy is working off the excesses of a burst credit bubble and federal spending and deficits are at an all time high.   


Spending and Taxes from 1930 on
Source: White House
As you can see above, spending is at at a peacetime high and taxes are near a post WWII low. (Both relative to GDP.) Combine the two and you have the largest peacetime deficit from 1900 onward. (The data from the White House doesn't go back any further than 1900, so there may be another time period before then however I doubt we have experienced peacetime 10+% budget deficits before.)


Today we can see the credit bubble bursting in a chronically high unemployment rate and sluggish GDP growth.  Unlike other downturns, our GDP did not rebound much. 


Real US GDP
Source: Federal Reserve

A ~2.5% GDP growth rate after coming out of a recession is quite low as compared to historical norms.

Raising taxes too quickly combined with actual spending cuts on an already slowly growing economy could send us immediately into a recession.  This is what has Wall Street in a current tizzy and is already hitting consumer confidence.

Predictions about the future are tricky, especially when politicians are involved.

How much taxes go up, and if there are any actual spending cuts will determine how much of a fiscal drag hits the economy in 2013.  Right now it's all speculation and I'm not going to try to predict what Congress and the President will eventually agree to, before or after January 1, but there are a few items which appear certain:

  • Taxes will go up, but not as much as 1937 on a percentage basis
  • Spending will most likely not decline on an absolute basis
  • Federal spending is a much larger percentage of the economy than in 1937
  • The Federal Reserve will NOT shrink its balance sheet in 2013

How much taxes will go up and on whom is the unknown and that is what is creating uncertainty in the mind of corporations and individuals.  Until we have clarity both the markets and consumer actions may be volatile.

Additional reading:

http://www.ritholtz.com/blog/2012/12/what-is-the-fiscal-cliff/

http://www.cringely.com/2012/12/16/dr-al-explains-the-so-called-so-called-fiscal-cliff/

http://soberlook.com/2012/11/putting-fiscal-cliff-in-perspective.html

I actually wrote about this 2+ years ago as I was studying the history of the Great Depression.
http://merrillovermatter.blogspot.com/2010/06/is-steep-yield-curve-leading-us-astray.html

Thanks to
 @mbusigin 1937 fed data
 @AlephBlog When is a 'cut' really a 'cut' in Washington speak (hint, not very often)    


Monday, February 6, 2012

A housing update -- at best a flat market

Over the last few years during conversations with clients I've frequently been asked my opinion about the housing market and whether now is a good time to buy.  Home prices are naturally a point of conversation as they are a large part of most people's net worth and the loss of equity is preventing some people from moving up or refinancing.  So the question of whether we are at the bottom of home prices is an important one.  Unfortunately I don't think we are at the absolute bottom of home prices and we will most likely continue to see a slow decline in prices in the near future.  My non-prediction for 2012 is we will not see a rebound in home prices; at best we'll see a flat to slightly down market.

Home prices have strong local factors so this conversation is about national trends, your local market will vary.

Unfortunately right now home prices are continuing their decline nationwide:
Home prices still dropping - (Source: Paper Money)


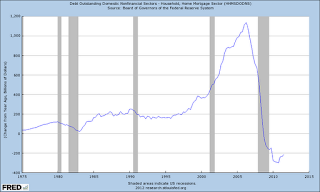
Outstanding mortgages still contracting
Mortgage loan balance still declining
There are several headwinds the housing market needs to overcome before it is fully healed. This chart shows the change in mortgage values outstanding since 1975 (Source: Federal ReserveLooking at loan balances to predict home prices may seem counter intuitive but remember a rising total national loan balance means there are more buyers (and borrowers) entering the market.  Some interesting aspects of this chart are how even during other previous recessions (shown in gray) the value of outstanding mortgages continued to rise on a year over year basis; until our most recent recession in 2008/2009.  This was the first time during this entire data series when the total value of all mortgages outstanding declined on a year over year basis. One would not be engaging in hyperbole to call our current decline in home prices exceptional.

An overhang of foreclosed homes
While it appears the primary wave of home foreclosures is past us there still is a large backlog of homes in the foreclosure process. Until this backlog is completely cleared and returns to more 'normal' levels, the amount of housing coming on the market by 3rd parties (not the person who currently lives/owns the home) will put downward pressure on prices.

Single family delinquency rate (Source: CalculatedRisk)

Another negative factor is the hidden inventory of homes out there from people who want to move up or out but are waiting until home prices stabilize before putting the place on the market. I personally know of a few people who are accidental landlords and are hoping and waiting until prices stabilize before putting their rentals on the market.  While this is purely anecdotal I'm sure its not just a local or isolated phenomenon.

Renting versus Owning coming into balance
Fortunately there are some positive factors which should mitigate a continued decline in home prices.  Home prices and mortgage rates have declined to the point where a mortgage now equal to rent.
Rent versus Owning (Source: Soberlook)
As you can see for a very long time it was cheaper to rent versus own. We are approaching a point where this may invert and owning a home would be cheaper than renting. There are other upkeep and time costs associated with home ownership (as a homeowner I can assure you there are many!) but the primary costs are approaching parity.  

Clearing the excess inventory
The number of unsold homes is beginning to stabilize as a percentage of US population.  The hidden inventory is of course hard to measure but at least we are getting closer to 'normal' for this data series
Unsold homes as % of population - (Source: Sober Look)

The long decline in construction spending does appear to be finally over which will help the building trade and stop being a drag on overall GDP growth.
Construction finally bottoming? (Source: Federal Reserve)

Even though the housing market decline appears to be slowing forecasting when we finally reach bottom is not something I'm willing to predict right now. I believe the worst of the declines are behind us so if you are looking for a home now would be a good time to start looking but be picky and drive a hard bargain! There is going to be lots of supply coming on the market over the next few years.

One aspect of the crushing decline in home prices is it has popped the speculative mindset so very prevalent in American thinking a few years ago. (I'll admit to falling a little under that spell myself)  Take your time and find a house to live in, not one for profit.

Additional reading:
http://www.calculatedriskblog.com/2012/01/fannie-mae-serious-delinquency-rate.html
http://soberlook.com/2012/01/two-data-points-on-us-housing.html
http://paper-money.blogspot.com/2012/01/new-home-sales-december-2011.html
http://soberlook.com/2012/01/five-reasons-2012-will-be-start-of-us.html
http://paper-money.blogspot.com/2012/01/radar-watching-november-2011.html
http://paper-money.blogspot.com/2012/01/fhfa-monthly-home-prices-november-2011.html
http://paper-money.blogspot.com/2012/01/radar-watching-november-2011.html
http://pragcap.com/why-home-prices-have-much-further-to-fall
http://www.tilsonfunds.com/JohnBurnshousing.pdf
http://research.stlouisfed.org/fred2/graph/?graph_id=62720&category_id=4082
http://research.stlouisfed.org/fred2/graph/?graph_id=64527&category_id=4082
Calculated Risk calls a housing bottom
http://www.calculatedriskblog.com/2012/02/housing-bottom-is-here.html

Tuesday, November 1, 2011

Mr. Bond (Market) is not impressed

Do I look impressed?
Even before the Greek referendum drama of the last 24 hours the bond market was not impressed with the latest Euro crisis 'solution'.

With Portugal, Ireland and Greece all tipping over the edge the next domino to watch is Italy.

Last week's news of a 50% 'voluntary' haircut for some Greek debt vaulted world equity and currency markets higher in a massive relief and short covering rally.  Mr. Bond market was not so impressed.

While both the absolute and relative yield of Italy's 10 year bond did fall a bit late last week on the news of the news of a new solution to the Greek debt situation announced Thursday morning by Friday afternoon Italian yields were creeping upwards again.
The German/Italian 10 year spread has blown out to new highs


Very close to breaking recent highs

The news of a Greek referendum on the latest round of negotiations shocked the markets and drove almost every risk asset downward with only the dollar and US Treasuries rallying. Italian yields are not looking good from a technical perspective and if they break 7% it could be the final domino to fall before the real euro crisis starts.  I'll be watching these metrics closely.


Tuesday, October 25, 2011

Ray Dalio on the challenges in front of us

Ray Dalio of Bridgewater Associates has recently appeared on the Charlie Rose show as well as written a piece for the Financial Times. I think he does a good job of describing how we got here (continually borrowing money to improve our standard of living) and the tenuous situation we find ourselves in (Greece, falling home prices, etc.)

From FT.com

We are in the midst of a deleveraging, we are nearly out of ammunition and we are at each other’s throats. Being in a deleveraging and nearly out of ammunition is a very difficult position to be in. But, being at each other’s throats is our biggest problem.
Our character and our political and social systems are now being tested in ways that have typically been tested in past deleveragings. In deleveragings bad economic conditions typically lead to emotional reactions, social and political fragmentation, poor decision-making and increased conflict. When this occurs in democracies, the checks and balance system, which is intended to yield the best decisions for the whole, can stand in the way of thoughtful leadership and lead to ineffective “mob” rule. This dynamic can lead to a self-reinforcing downward spiral.
The video goes into a little more detail of his philosophy of knowing what you don't know and being willing to have your ideas and conclusions challenged throughout the corporate structure.  I suggest you read both the article and watch the interview.

Thanks to The Intrigued Trader and Also Sprach Analyst

Wednesday, July 6, 2011

Economics for the post MTV Generation -- It's the debt stupid

I previously mentioned an entertaining video regarding the competing economic theories of Keynes and Hayek.  Here is round two, and while its a few months old it deserves attention.

When watching the video pay close attention to the assistants to each boxer, you may recognize some other names as well as what appears to be Chairman Ben Bernanke in the first row of the meeting.


While the debate over monetary and fiscal stimulus continues (most recently as the wrangling over the federal debt limit) I'd like to repeat a graph I've shown before.


Total US debt (private, corp, government) to GDP rose for this entire data series until the great financial crisis of 2008.  Since then its been dropping and this is one reason our recovery has felt so sluggish as corporations and individuals continue to delever.

I have mentioned before how even with a very steep yield curve we are not seeing a rebounding economy and others have noticed this as well; the steep yield curve mechanism appears broken.

From Bonddad:
for virtually the entire period beginning in late 1929 and continuing right through the Great Depression and into the 1950s, the yield curve was resolutely positive. And yet that period coincided with the two worst downturns in the last 100 years, as well as three other recessions.

Until the private sector deleverages monetary policy levers will be less effective. I have suspicions as to how Mr. Bernanke will 'fix' this problem but I'll leave that to a later post with evidence.

So what explains the current crisis and malaise? I think Steve Keen is on to something.  I strongly suggest you watch this video and examine his theories.

edit: sorry about the autoplay. Hit the pause button to stop it.


http://www.ritholtz.com/blog/2010/01/steve-keen-on-the-modern-economy-and-the-outlook/
http://www.debtdeflation.com/blogs/2010/07/07/naked-capitalism-and-my-scary-minsky-model/
http://www.debtdeflation.com/blogs/2009/12/01/debtwatch-no-41-december-2009-4-years-of-calling-the-gfc/

Thursday, December 23, 2010

Something to watch in the new year

The year is wrapping up and the US stock market continues to grind higher in a Christmas rally. While the US is in a much calmer state as compared to a year ago, not all is well across the pond in Europe.

The fiscal crisis in the PIIGS of Europe (Portugal, Ireland, Italy, Greece, Spain) has not been 'fixed' in my opinion and will most likely move up to the headlines in America very shortly.

Here you can see a chart of the PIIGS bond yields  (Bloomberg) and they are not going in the right direction. The spike and fall in May 2010 was due to Greek financial difficulties and the spike in November was from Ireland. Note how much faster the fall in yields after the Ireland event has been retraced as compared to the Greek event.

As this chart shows the absolute yields and not the relative 'risk' of the PIIGS regions looking at the combined CDS for the PIIGS (Bloomberg) provides a clearer view of perceived risk.  It too is almost at new highs and could very well exceed previous peaks before the new year.    I suggest you keep an eye on both of these indicators and if you see them shooting higher you will most likely see weakness in the equity markets as well.

Friday, October 15, 2010

Consumers and Credit -- Behaviors may not be changing

One item I follow are aggregate debt levels as well as additional focus on the consumer as they are a large portion of GDP.

A WSJ blog entry from Sept 18 caught my eye and the results of their analysis are very interesting.

Their conclusion is the consumer is not voluntarily deleveraging, rather it is from charge-off and defaults.  This information does synch with how retail sales continue slowly rising even in the face of declining credit. 

From the WSJ:

There are two ways, though, that the debts can decline: People can pay off existing loans, or they can renege on the loans, forcing the lender to charge them off. As it happens, the latter accounted for almost all the decline. Our own analysis of data from the Fed and the Federal Deposit Insurance Corp. suggests that over the two years ending June 2010, banks and other lenders charged off a total of about $588 billion in mortgage and consumer loans.
That means consumers managed to shave off only $22 billion in debt through the kind of belt-tightening we typically envision. In other words, in the absence of defaults, they would have achieved an annualized decline of only 0.08%.


Interesting data providing for very different conclusions. People will shop until their credit cards are pried from their cold dead fingers.

Tuesday, September 21, 2010

Shadow inventory: More homes coming

I have spoken before about how the supply of forced sale (foreclosed or short sale) inventory continues to increase but may be close to peaking. Here's an article stating the peak is not yet in and we have more to come:

From Realestatechannel comes some rather scary data regarding how the pipeline continues to be filled and they see no let up on new supply being dumped on the market.

If this were early 2005, one could claim that 40% of homeowners who were delinquent 90 days or longer would eventually bring the mortgage current. But the cure rate has plunged along with home prices. As early as one year ago, the cure rate had dropped to almost zero. A delinquency of 90+ days now means almost certain foreclosure or short sale.

. . .  To come up with a total for the shadow inventory, let's first add the total number of loans in default to those delinquent 90 days or more since we know that these loans are headed for foreclosure or a short sale. That comes to 4.5 million properties. Based on the cure rate for loans delinquent at least 60 days, we will add 95% of those 60-day delinquencies. That is an additional 723,000 residences. For the same reason, we will add 70% of those delinquent for at least 30 days - 1.25 million properties.
And, of course, let's not forget the REOs that have not yet been placed on MLS listings by the bank servicers. We'll be conservative and estimate them at 500,000. Adding all of these together, we come up with a total of roughly 6.97 million residences which are almost certainly going to be thrown onto the resale market as distressed properties at some point in the not-too-distant future. This massive number of homes will put enormous downward pressure on sale prices. To believe that prices are firming now is to completely ignore this shadow inventory. Ignore it at your own risk.
I suggest you read the whole article.

ht: PragCap

Monday, September 20, 2010

One small facet of the the mortgage mess

NPR (National Public Radio) has a great ongoing series about the mortgage mess.  As a centerpiece to the series they purchased a slice of one very sick package of mortgages and are investigating the mortgages inside it.  So far they have found some serious mortgage fraud as well as some other interesting stories.  Take a look at one small facet of the housing bubble:

NPR: Planet Money's Toxic Asset

ht: NicTrades

Wednesday, July 14, 2010

Late Night Linkage

Postings have been light due to some business related demands.  Here's some links to my recent reads from the last few days.

Humor
Vuvuzela -- Will it blend? Youtube

Gold
Telegraph - did BIS gold swap spook the markets?

China
From Chinadaily - Property restrictions continue.
Chinadaily - Home price appreciation slows.
Chinadaily - Rate of lending slows in China.

Residential
From CalculatedRisk - A Chapter 13 bankruptcy can wipe away a 2nd lien.

Commodities
From FT -- The financialization of commodities.

LNG
From Hellenicshipping - A lot of spare LNG ships standing idle.

Lumber
Globe and Mail - Canada exporting lumber to China.

Sovereign debt
CalculatedRisk - How much debt is there and what is the probability of default?  It's a multi part series. Good stuff.
GMO - White paper on defaults in history. Very good. Intend to write longer blog post about this.

BP / Oill spill
WSJ - BP has replaced old cap, trying new one in an attempt to stop leak.  (This is at least 24 hours old.)

Euro
Telegraph - Legal challenges to bailout of Greece.
WSJ - Moody's downgrades Portugal.

Debt
Annaly - The debt deleveraging continues.

Wednesday, June 30, 2010

Clarity on debt levels in China. They are high.

Getting precise numbers out of China is always challenging but data is slowly coming out. . .  From the Telegraph
Chinese provinces are, in some cases, equivalent in size to major European countries and run with a degree of fiscal autonomy. The southern province of Guangdong, for example, has the same population size as Germany. However, provincial budgets have been classified as state secrets until now and this is the first time that China has disclosed the level of local government debt.
Mr Liu said the ratio of debt to disposable revenues at some local governments was over 100pc and in the highest case it was 365pc. . .
Victor Shih, a professor at Northwestern University in the United States, believes the sum in 2009 was 11.4 trillion yuan, equivalent to 71pc of China's nominal GDP.
Mr Shih has warned that local governments have also succeeded in rapidly funnelling large amounts of debt off their balance sheet and into public-private investment vehicles.

ht Metalminer

No one is talking much about deflation . . . yet.

US Treasury rates have dropped recently and it appears to me they may continue declining.   How low can they go?  I have no idea but I thought it would be interesting to look at when 'deflation' was a popular search term on Google.  Click on the screen capture at the right and you'll see searches spiked around the same time long term US Treasury bond yields dropped very quickly.

I wonder if we'll get another spike in search traffic for deflation if bond yields fall again . . .

Wednesday, April 7, 2010

Watching the Greek tragedy -- 10 year Greek bond rates

The Greek Tragedy is not over, even with 'assurances' by the EU and IMF they stand ready to help.  If you'd like a front row seat to events and watch what everyone else is watching I suggest you keep an eye on 10 Greek bond yields.  While yields spiked and fell back earlier this year they have begun creeping upwards.  If they continue upwards this will eventually precipitate another risk-off selloff in the markets.

The recent debt auctions by Greece have been met with lower bid / cover ratios and lower foreign participation. 

Non-domestic investors accounted for 80 percent of purchases of the first bond in January, 77 percent of the second, and 57 percent of the third. Reuters
While the Greek issue has slid back off the front burner it has not been resolved.  Abrose Evans-Pritchard has an interesting blog post about this very issue recently and his conversation with Carmen Reinhart regarding the slow motion trainwreck that is Greece:

But I digress. Professor Reinhart said Greece cannot hope to escape from its debt trap under the current EU austerity plan. The cure of devaluation is blocked by EMU membership. The restrictive monetary policy of the European Central Bank — a contraction of both M3 money and lending to firms, record low core inflation — must inevitably unleash deflationary forces in Club Med states already trapped in credit busts.
A country can in theory deflate its way back to competitiveness by an `internal devaluation’, ie relative wage cuts, in this case by 20pc to 25pc . . .
On a parting note, Professor Reinhart says the only budget deficit that matters in a crisis is the “cash deficit”, and this reached 16pc of GDP in Greece last year — not the 12.7pc officially registered under “accrual” accounting.
As countries near default, they typically find all kinds of way to disguise their troubles, by shifting debts between government agencies and delaying payments.
“In the end, everything comes out of the woodwork. You realize that it is even worse than you thought,” she said.
Greece is seriously behind the 8 ball and faces tough choices with no easy solution.  They can either drastically cut spending and face a severe recession, accept IMF/EU austerity and lending support, or even default and leave the Euro. I think the last option is least likely but I'm not making any bets for a positive outcome regardless of what happens.

Carmen Reinhart has a recent  interesting paper regarding country growth rates declining as debt/GDP levels rise.  I am currently reading the book she co wrote - This Time is Different and the paper is an excellent primer to the detailed description in the book. Read the paper and then consider buying the book.

The pragmatic capitalist also has some video by MIT professor Simon Johnson about the Greeks.

The locals are also fleeing the Greek financial system.  From the Telegraph:  (ht Zerohedge)

More than €3bn (£2.6bn) of deposits held by Greek households and companies left the country in February, while in January about €5bn of deposits were moved out, according to the latest figures available from the Bank of Greece.

Switzerland, the UK and Cyprus have been the largest recipients of the money, with the wealthiest Greeks looking to move their deposits to Swiss banks accounts to escape the more punitive tax measures many fear will be introduced in the wake of the country's economic crisis.

It's never good when the locals start pulling money out of the banks. . . .