Tuesday, March 30, 2010

Will HELOC's toast the banks?

Ouch... I read this several days ago and after turning it over in my head it jived with my previous tinfoil allegation the banks are managing their losses over time  . . .

From Creditwritedowns:
About a month ago I wrote a post called “The coming wave of second mortgage writedowns” the gist of which was that the big four banks (Citi, JP, BofA, and Wells) had a shed load of exposure to now worthless second mortgages. With many first mortgages now hopelessly underwater, it stands to reason that second mortgages on those same properties have zero value. . . .
So the original loss from second-liens, as reported by the stress tests, was $68.4 billion for the four largest banks. If you look at those numbers again, and assume a loss of 40% to 60%, numbers that are not absurd by any means, you suddenly are talking a loss of between $190 billion and $285 billion. Which means if the stress tests were done with terrible 2nd lien performance in mind, there would have been an extra $150 billion dollar hole in the balance sheet of the four largest banks. Major action would have been taken against the four largest banks if this was the case.
Please go over and read the whole thing. I stopped following the bank several quarters ago. Any additional facts on this possibility would be appreciated.

This would explain the banks' dragging their feet foreclosing properties.  Not only would they have to mark down their first mortgage but the 2nd lein would be marked to zero instead of the 15-20% loss as described in the 'Stress Tests' of early last year.

Monday, March 29, 2010

A clever etf tool with a reverse stock lookup feature.

http://www.xtf.com/ has a great feature on their web site I have been looking for -- reverse stock lookup. You can type in a stock symbol and find what etf's hold that company. Sort by size and you can instantly find sector etfs.  This is a great way to find similiar stock or etfs.

http://www.xtf.com/

The reverse stock / etf lookup feature is free after signup.  Give it a try!

Friday, March 26, 2010

Inventory / Sales ratio back to "Normal"

Inventory / Sales ratio data is pretty much back to normal, as I mentioned in the last update of this data series.  The ratio ticked down a little.  Not much to see here, move along. . . .

Thursday, March 18, 2010

Inflation expectations and the Treasury market

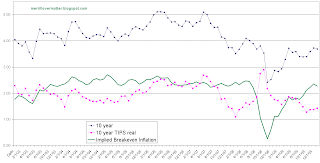
Here's your TIP / Treasury market update.  Nothing extraordinary has happened in the Treasury / TIP market in the last few months.  As mentioned in my last entry the easy money has been made and now it is a lot harder (Tips v. nominals)

One item of note is the real TIPS yield is still relatively low as compared to the history of this data series with the last entry being a 1.42% real yield.  Not very exciting, eh?  The 10 year breakeven inflation rate is effectively where it was two years ago before the Financial panic hit (2.27%) 

Wednesday, March 17, 2010

About this blog

I started writing this blog with several goals in mind:  Producing work for consumption by others forces one to collect and present your thoughts in a slightly more organized manner as well as be more diligent in checking your facts and figures.  This is similiar to the few occasions I have taught or presented material in an academic setting. As this was very long ago I fear my meagre writing skills have deteriorated since then. Writing a blog will hopefully improve those rusty skills.

There are numerous blogs posting an almost infinite amount of data and opinions on the web.  If the blogosphere is concentrating on a topic I will very likely NOT comment upon it as you have most likely already read about it elsewhere.  No need to waste our time repeating the hot news of the day. 

Right now I anticipate I will blog mostly about various data series I keep up with and some short commentary on the data.  I'll occasionally post my opinions about various events or predicitions but I'll keep my posts short and to the point (I may digress but I'll try to restrain myself)  I am not a verbose writer and like myself you are probably overwhelmed with data and opinions on the markets. 

I am a fee only financial advisor and money manager in Tacoma, Washington, USA  Here is my long term track record so if you are looking to pay someone please consider me.  (That's the end of my pitch)

This blog is not to be construed as financial advice by any stretch of the imagination. I do not know your financial needs or desires, your cash flow needs, your debt level, current and future tax rates, your tolerance for risk, what country you live in, how many kids you have, how variable your income flows are, etc.  Don't come crying to me if I say I'm buying or selling something and the trade blows up on you.

I'm NOT going to tell you my total portfolio make up.  I will not however tell you to buy something if I'm short it or closing out my position.  That's called being unethical. 

Almost all my posts will not be edited or revised later.  There are a few exceptions (like this post) and a few others which will be living documents but these will be marked as such.   While I may make spelling or grammatical changes within a short time after posting I intend this blog to be a record of my thoughts over time. (If I do make edits beyond spelling or typos it will be duly noted as such in the entry.)

Please make comments or ask questions!  The blogosphere is great for connecting with others to share research or honestly debate situations.  While I'm a busy guy I'll try to at least respond to your queries.

[edited 2010 08 17 to clean up some prose]

North Korea - The craziest country in the world

Here's an impressive graphic with some stats surrounding North Korea.   The image may be a bit too small to read; here's the original.


Tuesday, March 16, 2010

Money Money + Money -- Money Supply

I'd like to thank Annaly's blog for introducing this bit of data to me. The Fed stopped producing the M3 money supply series several years ago and while there are some common attempts to recreate the data series I prefer to publish data I can get my hands on and cite.  Shadowstats.com produces the most well known M3 series.  As you can see M3 growth has recently fallen onto the negative side of the ledger.


Annaly recently wrote about M2 + Institutional Money Market Funds which I have reproduced here.  Over time I'll include some additional data in the graph so you can see the long term relationship between money supply growth and inflation. Right now the important point is money supply growth is negative on a year over year basis, something that has not happened over the entire data series. 

This is another example of the decline in lending, money supply, et al, occuring in America.  What do you think will happen as all the government stimulus starts to unwind?

Monday, March 15, 2010

Total consumer debt continues falling & Consumer debt / GDP perspective

Total consumer debt statistics (all debt including home loans) came out recently and the credit decline continues.  I have produced a couple of graphs to provide some perspective on the data. 

Year over year consumer debt is still falling but at least we are no longer speeding up in our rate of decline.  Looking back you can also see we have not had a period of negative growth any time during the entire data series.

Observing total consumer debt to gdp (both in nominal terms) provides some interesting fodder for discussion. During the 1990's consumer debt / GDP rose <10%. Compare that to the 2000's where the growth rate was much faster. 

The consumer debt / gdp ratio has consistenly risen over the long term.  This ratio cannot rise forever!  Is parity where one starts to encounter serious problems? 

The Wall Street Journal ran a page one article regarding declining debt Friday, March 12 describing how defaults are reducing the total debt load of American consumers.

U.S. consumers are shedding debt at the fastest rate in more than six decades, largely through a wave of defaults, in a trend that underscores the depth of their financial troubles but could also help clear the way for a stronger economic recovery.


Total U.S. household debt, including mortgages and credit-card balances, fell 1.7% in 2009 to $13.5 trillion, the Federal Reserve reported Thursday—the first annual drop since records began in 1945. The debt amounts to $43,874 per U.S. resident.

While some of the decline is from consumer defaults, this is not a 'pain free' method of debt reduction.  Banks become capital deficient and reduce their lending when they take losses in excess of their models.

Longer term it is healthy for the economy to have a lower debt load but the path there is not easy.

Wednesday, March 10, 2010

Temporary workers increase year over year. Good news or a head fake?

Temporary worker employment has finally turned positive on a year over year basis.  Unfortunately this could be a head fake due to the current census temporary employment surge going on right now.  Fortunately the temporary census workers employment blitz should be over with before the usual seasonal peak in October / November.  If the seasonal peak of 2010 is above that of the previous year we may have a 'positive' bit of news to share with the world.

Monday, March 8, 2010

Loan sharking Greece, I see someone in Germany is reading my blog

I doubt I have that much influence on German M.P's as the idea of posting collateral for a loan is not that exotic. . .

"The Greek state must sell stakes in companies and also assets such as, for example, unpopulated islands," Frank Schäffler, a member of parliament for the pro-business Free Democrats, told the Bild daily.
Getting the Greeks to hand over title after they default could be another matter.  For those of you who think that unlikely; Greece has spent the majority of time since 1800 in default.  (This Time Is Different, 2009, page 98 & 99)

Friday, March 5, 2010

Home loan delinquencies continue hockey sticking

Here's some additional news to reiterate what I mentioned yesterday....

Both the percentage of people behind on their mortages and the number of homes owned by the GSE's continues to climb.   I was hoping that some of these data points would start to at least level off but alas I'm too optimistic.

To quote calculatedriskblog:

Even with all the delays in foreclosure, the REO inventory has increased sharply over the last two quarters, from 135,868 at the end of Q2 2009, to 153,007 in Q3 2009, and 172,357 at the end of Q4 2009.


Fannie Mae reported last week that the rate of serious delinquencies - at least 90 days behind - for conventional loans in its single-family guarantee business increased to 5.38% at the end of December, up from 5.29% in November - and up from 2.42% in December 2008.
Until both of these data series start to actually decline real (inflation adjusted) home prices will not appreciably go up. 


Thursday, March 4, 2010

Living Rent Free

Trader Mark from fundmymutualfund.com had a great post about the apparent disconnect between income and spending -- it's not adding up.  I had my own suspicions about this but TraderMark does a much better job skewering several sacred cows so I'll defer to his rapier and wit:
I was looking through the avalanche of economic data today, and it struck me how once again Americans are spending well over their income growth.  
I've written about this in the past in conceptual terms but never put it into an analysis. The true stealth stimulus plan in America is letting so many of its people live "rent free" as they sit in defaulted homes not making a mortgage payment. This "cost savings" allows them to shop and spend, and otherwise support the American consumption society.
From anecdotal stories (many of them) it is now taking at minimum 9-12 months to get evicted, and that's in states without super high foreclosure rates. I read the other day some Florida locations are 2+ years now. So 9, 12, 15, 18 months of not having to make a $1200, $1500, $1800 payment. And it can go longer now if you enroll in the trial modifications offered by government, then redefault. If you are really good at playing the system you might be able to go through two whole default cycles with the trial modification in the middle. 3 years of rent free living? Nirvana.
Further, with the new accounting rules that were the nexus of the market rally in March 2009, the banks no longer had to mark value of assets on their balance sheet to market... so they can now mark to what they see fit. Hence this system works for them too. All these foreclosures they should be closing on are things they are in no hurry to do... because doing so would mean they need to stop pretending about the true valuation of these defaulting mortgages and start admitting reality. Don't you love what 1 change in accounting rules can do for a country? ;)

My suspicion is the banks decide how much of a loss they want to take on home loans each quarter and then foreclose enough homes to make that quarter.  (The easiest number for a bank to hit for the next several years!)  The Feds are turning a blind eye as they are terrified of another drop in home prices and want to keep the banks 'solvent'  All the mortgage modification programs give cover to the banks to delay foreclosures and regulate the supply of homes hitting the market. 

How does that saying go??? Owe the bank $10,000 and they own you, owe the bank $50 million and you own the bank.  In America we can do it better:  Own a trillion in mortgages and you own the US Government.

Monday, March 1, 2010

Inflation update

Inflation numbers came out a little while ago and it continues to show a decline in overall inflation rates excepting the volatile food and energy segment.   All the data shown is year over year, non seasonally adjusted.  
Core CPI inflation (line in Red) continues a slow decline.  CPI Housing (line in Green) remains stuck at below zero and will most likely remain there for a while.  The Wall Street Journal has some more detail on the data.

For all of you looking for inflation, where is it?  Money supply is falling (I'll post about that soon(tm) ), credit is contracting, the dollar is getting stronger, and inflation is falling.  Longer term I concede it is possible but over the next 12 months I don't see it.