Wednesday, April 14, 2010

Popular media discovering where all those delinquent mortgage payments are going

I was going to blog about this yesterday afternoon but fundmymutualfund yet again scooped me on the entry and added his usual commentary to the matter.  As I have implied before the money NOT going to paying a mortgage is just being spent by Joe and Jane Consumer. 

Diana Olick of CNBC:

Okay, so 7.9 million Americans are not paying their mortgages.

Are we really thinking about the implications of that?
I've already reported studies that show Americans are now far more likely to pay their other bills first before their mortgage (which is a big turnaround historically speaking.)
That means they pay off their credit cards, cable bills, car loans in place of their home loans. Some are forced to, while others are doing so strategically. Don't get me started again on strategic defaults...
Paul Jackson, publisher of Housingwire.com, wrote a fascinating article last week that put this into real cash perspective.
First he describes a case study of someone who applied for the government's Home Affordable Modification Program.
The person had an $1,880.00 monthly mortgage payment on which they'd defaulted, but said person's monthly bank statement showed payments to a tanning salon, nail spa, liquor stores, DirecTV bill with premium charges, and $1,700.00 in retail purchases from The Gap, Old Navy, Home Depot, Sears, etc.
Writes Jackson:
Even if you assume that just half of the current 7.4 million currently delinquent mortgages fit this sort of ’spending profile’ (that is, they are spending their mortgage) and you assume a $1,000 median monthly mortgage payment for most U.S. homeowners — you get a $3.7 billion boost per month to consumer spending. It’s certainly enough spending to matter in the overall scheme of things.
To sum up the program as described by fundmymutualfund:

So for newer readers here is the 'game' as I've outlined many times.


1.Home'owners' default.. many of which are owners only in practice (not putting a dime down on their home).
2.That money once used to pay mortgages can now go into the economy as a form of permanent stimulus via consumption. Back in November I figured the number to be akin to the spring 2008 Bush stimulus - but instead of a 1x benefit, it's a permanent stimulus.
3.The banks drag feet on foreclosures because to make their balance sheet look good they will only take so many foreclosures over in any 1 quarter. Since the FASB (accounting board) rule change, they can do this since they don't have to mark the mortgages to reality - they can pretend... until of course the actual foreclosure. So the majority of mortgages on their books are still at "their discretion" and only the % they foreclose on, do they have to mark to "market" (i.e. reality). Hence the 6 months foreclosure now turns into the 18+ month foreclosure.
4.The market could care less about losses for large banks or the reality of the balance sheet because the US government stands behind all major banks... they are too big to fail. So the banks have nothing to worry about. Buy financial stocks - they are risk free, like Treasuries.
5.In the meantime Ben Bernanke will keep rates at 0% so the banks can "out earn" the losses. [Apr 20, 2009: How Banks Will "Outearn" Their Losses] Borrow from Fed at 0%, invest in anything (stocks, bonds...heck even do some loans), and make the spread. Use that 'free money' to offset foreclosure losses.
Presto magic!

So tell me what you think will happen to consumer spending when those 10% of people with late mortgages finally get kicked out of their homes and the banks are finally forced to realize the loss on the loan?  You wonder why the banks are not lending?  Extend and pretend only works so long. . .

Tuesday, April 13, 2010

A veteran's view on short term interest rates pinned at zero

While I disagree with Mr. Koo's prescription for getting out of Japan's mess (more stimulus) his battlefield view of what happened and why Japan is going on 20+ years of malaise should not be discounted:


(ht: Pragmatic Captialist)

Jim Chanos on China and Rogoff on Excessive debt

Here's 2 interviews for your digestion.  Jim Chanos last night on Charlie Rose regarding China and Mr. Rogoff on how excessive debt growth eventually gets you into trouble.  I reccommend (again) you read the book "This time is different" by Rogoff & Reinhart

Charlie Rose Interviews Jim Chanos

Charlie Rose Interviews Kenneth Rogoff

Monday, April 12, 2010

Consumer credit continues dropping

Consumer credit continues falling.  The rate of decline appears to have stabilized but this means consumer credit continues to contract with no anticipated point of stabilitzation.


Longer term a deleveraged consumer is good news.  Getting there is not pleasant, whether it be from consumer paydowns or bank writing off debts.  As I have mentioned before the decline in consumer credit and debt prevents a strong recovery.  Not only is the added impulse of new debt (and thus spending) missing but the additional drag of debt reduction is still present.

After the inventory bounce recedes in the next 2 quarters GDP growth will remain muted in my opinion.

Wednesday, April 7, 2010

Watching the Greek tragedy -- 10 year Greek bond rates

The Greek Tragedy is not over, even with 'assurances' by the EU and IMF they stand ready to help.  If you'd like a front row seat to events and watch what everyone else is watching I suggest you keep an eye on 10 Greek bond yields.  While yields spiked and fell back earlier this year they have begun creeping upwards.  If they continue upwards this will eventually precipitate another risk-off selloff in the markets.

The recent debt auctions by Greece have been met with lower bid / cover ratios and lower foreign participation. 

Non-domestic investors accounted for 80 percent of purchases of the first bond in January, 77 percent of the second, and 57 percent of the third. Reuters
While the Greek issue has slid back off the front burner it has not been resolved.  Abrose Evans-Pritchard has an interesting blog post about this very issue recently and his conversation with Carmen Reinhart regarding the slow motion trainwreck that is Greece:

But I digress. Professor Reinhart said Greece cannot hope to escape from its debt trap under the current EU austerity plan. The cure of devaluation is blocked by EMU membership. The restrictive monetary policy of the European Central Bank — a contraction of both M3 money and lending to firms, record low core inflation — must inevitably unleash deflationary forces in Club Med states already trapped in credit busts.
A country can in theory deflate its way back to competitiveness by an `internal devaluation’, ie relative wage cuts, in this case by 20pc to 25pc . . .
On a parting note, Professor Reinhart says the only budget deficit that matters in a crisis is the “cash deficit”, and this reached 16pc of GDP in Greece last year — not the 12.7pc officially registered under “accrual” accounting.
As countries near default, they typically find all kinds of way to disguise their troubles, by shifting debts between government agencies and delaying payments.
“In the end, everything comes out of the woodwork. You realize that it is even worse than you thought,” she said.
Greece is seriously behind the 8 ball and faces tough choices with no easy solution.  They can either drastically cut spending and face a severe recession, accept IMF/EU austerity and lending support, or even default and leave the Euro. I think the last option is least likely but I'm not making any bets for a positive outcome regardless of what happens.

Carmen Reinhart has a recent  interesting paper regarding country growth rates declining as debt/GDP levels rise.  I am currently reading the book she co wrote - This Time is Different and the paper is an excellent primer to the detailed description in the book. Read the paper and then consider buying the book.

The pragmatic capitalist also has some video by MIT professor Simon Johnson about the Greeks.

The locals are also fleeing the Greek financial system.  From the Telegraph:  (ht Zerohedge)

More than €3bn (£2.6bn) of deposits held by Greek households and companies left the country in February, while in January about €5bn of deposits were moved out, according to the latest figures available from the Bank of Greece.

Switzerland, the UK and Cyprus have been the largest recipients of the money, with the wealthiest Greeks looking to move their deposits to Swiss banks accounts to escape the more punitive tax measures many fear will be introduced in the wake of the country's economic crisis.

It's never good when the locals start pulling money out of the banks. . . .

Tuesday, April 6, 2010

Chinese lending update --- Is the peak in?

It's been a while since I last updated you on Chinese loan growth.  Some of that was due to the problems of getting the data out of China. I was finally able to extract the data and it appears the peak in lending is finally in.  March data comes out soon but considering the difficulties of updating this data I thought I'd get you up to date now.

Even with the 'record' lending in the first two months of 2010 both the trailing twelve month total of lending and year over year percent change of total loans outstanding have peaked.

As with every massive increase in lending it ends up on all sorts of places and turns out to be much more prevalent than commonly thought.  Elite Chinese Politics blog (Mr. Victor Shih) has some serious allegations of hidden debt in the local government investment entities that are the analog of the Special Investment Vehicles (SIV's) of our banking bust.  Here's some more reading on the matter at businessinder.com and here.  Of course this is difficult to 'prove' as the Chinese accounting books are not the most transparent but Mr. Shih's work should not be discounted out of hand.  I suggest you go to his blog and read the comments and rebuttals.  It's good stuff. . .

Home loan delinquencies keep rising

From Calculatedrisk  Home loan delinquency rates keep going up.   As I have mentioned before this may be one reason consumer spending keeps slowly rising as people are just not paying their home loans. . .  

All these late paying homes represent a serious overhang of 'shadow' inventory hinted at by several blogs and news outlets. As you can see some portions of the 'shadow' can be quantified.  When this data series finally starts falling we'll hopefully start to see an end of the inventory overhang .  I'm not holding my breath.

Friday, April 2, 2010

Running into the Great Firewall of China

I access data from public Chinese webservers for some of the data I present on this blog.  During the start of the Google/China controversy I began to notice some odd 'errors' as I attempted to access Chinese web servers.  Sometimes I get a simple 'hello!' from the server and nothing else, other times I get a 404 error and other times there is no problem.  

I wonder if the 'Great Firewall of China' as described by the WSJ is working on keeping away the outsiders as well? 
China generally doesn't tell its people when it is interfering with their Web access, unlike some other countries, such as Saudi Arabia, that give explanatory warning messages when users are denied access to forbidden sites.

Instead, China's filtering can look to users like a technical glitch—an error message in a user's browser that makes it seem like his connection to the Internet malfunctioned. Authorities don't discuss the methods or tools they use.

Anyone else running into the same issues? 
Here's one test I just ran:
http://www.pbc.gov.cn/  -- Returns 'hello'
 
http://www.pbc.gov.cn/english/ -- Gives me a 404 error (page not found)
 
Both of those sites have worked on and off for a week or so. If you do a Google search for "people's bank of china" these are the first links you get and the Chinese central bank is not an obscure web site I'm hitting.  There's others web sites that return the same errors... puzzling . . . .

[edit 04/05/10 11:20am pst: I was able to access the above web sites on Saturday and pull the data I was looking for.  Today, Monday, I was unable to do so and received the same error messages.  I'm going to get a packet sniffer and see if the error message / 'hello' comes from the same location as the normal data and see if the Great Fire Wall is somehow blocking me ]

Tuesday, March 30, 2010

Will HELOC's toast the banks?

Ouch... I read this several days ago and after turning it over in my head it jived with my previous tinfoil allegation the banks are managing their losses over time  . . .

From Creditwritedowns:
About a month ago I wrote a post called “The coming wave of second mortgage writedowns” the gist of which was that the big four banks (Citi, JP, BofA, and Wells) had a shed load of exposure to now worthless second mortgages. With many first mortgages now hopelessly underwater, it stands to reason that second mortgages on those same properties have zero value. . . .
So the original loss from second-liens, as reported by the stress tests, was $68.4 billion for the four largest banks. If you look at those numbers again, and assume a loss of 40% to 60%, numbers that are not absurd by any means, you suddenly are talking a loss of between $190 billion and $285 billion. Which means if the stress tests were done with terrible 2nd lien performance in mind, there would have been an extra $150 billion dollar hole in the balance sheet of the four largest banks. Major action would have been taken against the four largest banks if this was the case.
Please go over and read the whole thing. I stopped following the bank several quarters ago. Any additional facts on this possibility would be appreciated.

This would explain the banks' dragging their feet foreclosing properties.  Not only would they have to mark down their first mortgage but the 2nd lein would be marked to zero instead of the 15-20% loss as described in the 'Stress Tests' of early last year.

Monday, March 29, 2010

A clever etf tool with a reverse stock lookup feature.

http://www.xtf.com/ has a great feature on their web site I have been looking for -- reverse stock lookup. You can type in a stock symbol and find what etf's hold that company. Sort by size and you can instantly find sector etfs.  This is a great way to find similiar stock or etfs.

http://www.xtf.com/

The reverse stock / etf lookup feature is free after signup.  Give it a try!

Friday, March 26, 2010

Inventory / Sales ratio back to "Normal"

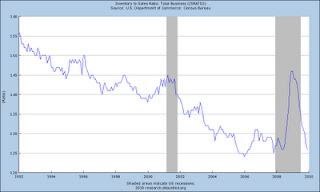
Inventory / Sales ratio data is pretty much back to normal, as I mentioned in the last update of this data series.  The ratio ticked down a little.  Not much to see here, move along. . . .

Thursday, March 18, 2010

Inflation expectations and the Treasury market

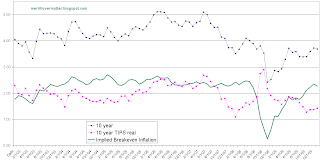
Here's your TIP / Treasury market update.  Nothing extraordinary has happened in the Treasury / TIP market in the last few months.  As mentioned in my last entry the easy money has been made and now it is a lot harder (Tips v. nominals)

One item of note is the real TIPS yield is still relatively low as compared to the history of this data series with the last entry being a 1.42% real yield.  Not very exciting, eh?  The 10 year breakeven inflation rate is effectively where it was two years ago before the Financial panic hit (2.27%) 

Wednesday, March 17, 2010

About this blog

I started writing this blog with several goals in mind:  Producing work for consumption by others forces one to collect and present your thoughts in a slightly more organized manner as well as be more diligent in checking your facts and figures.  This is similiar to the few occasions I have taught or presented material in an academic setting. As this was very long ago I fear my meagre writing skills have deteriorated since then. Writing a blog will hopefully improve those rusty skills.

There are numerous blogs posting an almost infinite amount of data and opinions on the web.  If the blogosphere is concentrating on a topic I will very likely NOT comment upon it as you have most likely already read about it elsewhere.  No need to waste our time repeating the hot news of the day. 

Right now I anticipate I will blog mostly about various data series I keep up with and some short commentary on the data.  I'll occasionally post my opinions about various events or predicitions but I'll keep my posts short and to the point (I may digress but I'll try to restrain myself)  I am not a verbose writer and like myself you are probably overwhelmed with data and opinions on the markets. 

I am a fee only financial advisor and money manager in Tacoma, Washington, USA  Here is my long term track record so if you are looking to pay someone please consider me.  (That's the end of my pitch)

This blog is not to be construed as financial advice by any stretch of the imagination. I do not know your financial needs or desires, your cash flow needs, your debt level, current and future tax rates, your tolerance for risk, what country you live in, how many kids you have, how variable your income flows are, etc.  Don't come crying to me if I say I'm buying or selling something and the trade blows up on you.

I'm NOT going to tell you my total portfolio make up.  I will not however tell you to buy something if I'm short it or closing out my position.  That's called being unethical. 

Almost all my posts will not be edited or revised later.  There are a few exceptions (like this post) and a few others which will be living documents but these will be marked as such.   While I may make spelling or grammatical changes within a short time after posting I intend this blog to be a record of my thoughts over time. (If I do make edits beyond spelling or typos it will be duly noted as such in the entry.)

Please make comments or ask questions!  The blogosphere is great for connecting with others to share research or honestly debate situations.  While I'm a busy guy I'll try to at least respond to your queries.

[edited 2010 08 17 to clean up some prose]

North Korea - The craziest country in the world

Here's an impressive graphic with some stats surrounding North Korea.   The image may be a bit too small to read; here's the original.


Tuesday, March 16, 2010

Money Money + Money -- Money Supply

I'd like to thank Annaly's blog for introducing this bit of data to me. The Fed stopped producing the M3 money supply series several years ago and while there are some common attempts to recreate the data series I prefer to publish data I can get my hands on and cite.  Shadowstats.com produces the most well known M3 series.  As you can see M3 growth has recently fallen onto the negative side of the ledger.


Annaly recently wrote about M2 + Institutional Money Market Funds which I have reproduced here.  Over time I'll include some additional data in the graph so you can see the long term relationship between money supply growth and inflation. Right now the important point is money supply growth is negative on a year over year basis, something that has not happened over the entire data series. 

This is another example of the decline in lending, money supply, et al, occuring in America.  What do you think will happen as all the government stimulus starts to unwind?

Monday, March 15, 2010

Total consumer debt continues falling & Consumer debt / GDP perspective

Total consumer debt statistics (all debt including home loans) came out recently and the credit decline continues.  I have produced a couple of graphs to provide some perspective on the data. 

Year over year consumer debt is still falling but at least we are no longer speeding up in our rate of decline.  Looking back you can also see we have not had a period of negative growth any time during the entire data series.

Observing total consumer debt to gdp (both in nominal terms) provides some interesting fodder for discussion. During the 1990's consumer debt / GDP rose <10%. Compare that to the 2000's where the growth rate was much faster. 

The consumer debt / gdp ratio has consistenly risen over the long term.  This ratio cannot rise forever!  Is parity where one starts to encounter serious problems? 

The Wall Street Journal ran a page one article regarding declining debt Friday, March 12 describing how defaults are reducing the total debt load of American consumers.

U.S. consumers are shedding debt at the fastest rate in more than six decades, largely through a wave of defaults, in a trend that underscores the depth of their financial troubles but could also help clear the way for a stronger economic recovery.


Total U.S. household debt, including mortgages and credit-card balances, fell 1.7% in 2009 to $13.5 trillion, the Federal Reserve reported Thursday—the first annual drop since records began in 1945. The debt amounts to $43,874 per U.S. resident.

While some of the decline is from consumer defaults, this is not a 'pain free' method of debt reduction.  Banks become capital deficient and reduce their lending when they take losses in excess of their models.

Longer term it is healthy for the economy to have a lower debt load but the path there is not easy.

Wednesday, March 10, 2010

Temporary workers increase year over year. Good news or a head fake?

Temporary worker employment has finally turned positive on a year over year basis.  Unfortunately this could be a head fake due to the current census temporary employment surge going on right now.  Fortunately the temporary census workers employment blitz should be over with before the usual seasonal peak in October / November.  If the seasonal peak of 2010 is above that of the previous year we may have a 'positive' bit of news to share with the world.

Monday, March 8, 2010

Loan sharking Greece, I see someone in Germany is reading my blog

I doubt I have that much influence on German M.P's as the idea of posting collateral for a loan is not that exotic. . .

"The Greek state must sell stakes in companies and also assets such as, for example, unpopulated islands," Frank Schäffler, a member of parliament for the pro-business Free Democrats, told the Bild daily.
Getting the Greeks to hand over title after they default could be another matter.  For those of you who think that unlikely; Greece has spent the majority of time since 1800 in default.  (This Time Is Different, 2009, page 98 & 99)

Friday, March 5, 2010

Home loan delinquencies continue hockey sticking

Here's some additional news to reiterate what I mentioned yesterday....

Both the percentage of people behind on their mortages and the number of homes owned by the GSE's continues to climb.   I was hoping that some of these data points would start to at least level off but alas I'm too optimistic.

To quote calculatedriskblog:

Even with all the delays in foreclosure, the REO inventory has increased sharply over the last two quarters, from 135,868 at the end of Q2 2009, to 153,007 in Q3 2009, and 172,357 at the end of Q4 2009.


Fannie Mae reported last week that the rate of serious delinquencies - at least 90 days behind - for conventional loans in its single-family guarantee business increased to 5.38% at the end of December, up from 5.29% in November - and up from 2.42% in December 2008.
Until both of these data series start to actually decline real (inflation adjusted) home prices will not appreciably go up. 


Thursday, March 4, 2010

Living Rent Free

Trader Mark from fundmymutualfund.com had a great post about the apparent disconnect between income and spending -- it's not adding up.  I had my own suspicions about this but TraderMark does a much better job skewering several sacred cows so I'll defer to his rapier and wit:
I was looking through the avalanche of economic data today, and it struck me how once again Americans are spending well over their income growth.  
I've written about this in the past in conceptual terms but never put it into an analysis. The true stealth stimulus plan in America is letting so many of its people live "rent free" as they sit in defaulted homes not making a mortgage payment. This "cost savings" allows them to shop and spend, and otherwise support the American consumption society.
From anecdotal stories (many of them) it is now taking at minimum 9-12 months to get evicted, and that's in states without super high foreclosure rates. I read the other day some Florida locations are 2+ years now. So 9, 12, 15, 18 months of not having to make a $1200, $1500, $1800 payment. And it can go longer now if you enroll in the trial modifications offered by government, then redefault. If you are really good at playing the system you might be able to go through two whole default cycles with the trial modification in the middle. 3 years of rent free living? Nirvana.
Further, with the new accounting rules that were the nexus of the market rally in March 2009, the banks no longer had to mark value of assets on their balance sheet to market... so they can now mark to what they see fit. Hence this system works for them too. All these foreclosures they should be closing on are things they are in no hurry to do... because doing so would mean they need to stop pretending about the true valuation of these defaulting mortgages and start admitting reality. Don't you love what 1 change in accounting rules can do for a country? ;)

My suspicion is the banks decide how much of a loss they want to take on home loans each quarter and then foreclose enough homes to make that quarter.  (The easiest number for a bank to hit for the next several years!)  The Feds are turning a blind eye as they are terrified of another drop in home prices and want to keep the banks 'solvent'  All the mortgage modification programs give cover to the banks to delay foreclosures and regulate the supply of homes hitting the market. 

How does that saying go??? Owe the bank $10,000 and they own you, owe the bank $50 million and you own the bank.  In America we can do it better:  Own a trillion in mortgages and you own the US Government.

Monday, March 1, 2010

Inflation update

Inflation numbers came out a little while ago and it continues to show a decline in overall inflation rates excepting the volatile food and energy segment.   All the data shown is year over year, non seasonally adjusted.  
Core CPI inflation (line in Red) continues a slow decline.  CPI Housing (line in Green) remains stuck at below zero and will most likely remain there for a while.  The Wall Street Journal has some more detail on the data.

For all of you looking for inflation, where is it?  Money supply is falling (I'll post about that soon(tm) ), credit is contracting, the dollar is getting stronger, and inflation is falling.  Longer term I concede it is possible but over the next 12 months I don't see it.

Friday, February 26, 2010

Hugh Hendry on China's chronic overcapacity and what it means.

Hugh Hendry once again nails it (in my opinion) as to what China's conversion into the workshop of the world really means.

This appetite for cheap Chinese exports, which had at one point seemed insatiable, means that we in the West have come to owe our largest Asian trading partner quite a hefty sum of money. China has become the world's biggest creditor, after amassing nearly $2.3 trillion of foreign exchange claims on us. However, the spectre of a creditor nation running persistent trade surpluses has ominous historical portents. It has happened only twice before, with the US economy in the Twenties and with the Japanese economy in the Eighties.
Read the entire article, it is not long.

Thursday, February 18, 2010

Consumer credit keeps contracting faster

Consumer credit data came out about 2 weeks ago and the numbers are not getting any better.  Unlike my previous entries showing the very long term I thought I'd zoom in a little to show you how this recession is unlike anything we've seen in the last 40 years.  Consumer credit keeps going down and the rate of declining is increasing.  Call this an anti-'green shoot'.

The economy will not properly recover and the Federal Reserve will most likely not raise interest rates too much (if at all) until consumer credit and bank lending start rising.  Until then, get used to very low short term rates.

Wednesday, February 17, 2010

Bank lending continues falling -- Are buying US Treasuries instead

Bank lending continues to fall on a year over year basis.  Compared to the previous two recessions in which bank lending stabilized and then renewed growing this time overall bank lending is down and is continuing to decline.

As you can see from the first graph they are instead following the pattern from the last two recessions and are increasing the US Government securities portfolios while cutting lending to the private sector.   Unlike private bank loans Treasuries are very liquid and can be sold immediately if cash is needed.   Capital requirements for Treasuries are also much lower compared to a private bank loan.  Considering the capital positions of most banks in America (I'll have a post on this soon)  are tenuous they need the liquidity and 'safety' of Treasuries.

The year over year change in bank's holdings of US Government securities does not show the full extent of the bank Treasury purchases. As you can see from the second graph the banks continue to load up and the slope is definately upwards.

Monday, February 15, 2010

Inventory bounce is pretty much over with

The Inventory / Sales ratio is pretty much back to 'normal'.  As such the inventory bounce contribution to GDP is over.  A lot of other blogs have the details but here's one picture that says it all. 

The quick and easy fixes to GDP growth have already occured.  It's going to be tough sledding now.

Friday, February 12, 2010

North Korea from another perspective

Ever since my previous posts on North Korea I have been on the lookout for more articles.  The pathology of how the the authorities are able to completely twist and warp the nations reality is fascinating to me.  Slate.com ran a recent article:

A Nation of Racist Dwarfs:  Kim Jong-il's regime is even weirder and more despicable than you thought.

Consider: Even in the days of communism, there were reports from Eastern Bloc and Cuban diplomats about the paranoid character of the system (which had no concept of deterrence and told its own people that it had signed the Non-Proliferation Treaty in bad faith) and also about its intense hatred of foreigners. A black Cuban diplomat was almost lynched when he tried to show his family the sights of Pyongyang.
Interesting reading . . .

Thursday, February 11, 2010

Copper update -- Nice to see I'm not alone in the wilderness

My bearish opinion of copper has been met with (polite) derision by some people.  It is nice to see I'm not the only one who is very bearish on the metal


One of the Fast Money members took the very opposite viewpoint from Threlkeld but I find his reasoning incorrect. As I have mentioned in previous posts copper inventories continue to rise and new supply (TCK for example) is coming from various sources. 

More on Threlkeld can be found in this Bloomberg article.

I haven't purchased BOS yet.  I'm hoping for a bounce from the copper selloff to initiate my position.

Wednesday, February 10, 2010

Hugh Hendry debating economists and ambassadors on the Euro and Greece. Loan sharking in the EU.

Hugh Hendry, in the guise of the evil speculator debates Stiglitz and the Spanish ambassador to the UK on the current situation in Greece.    The Greek situation is a mess and in my opinion a 'bailout' would create a tremendous moral hazard.  Ireland, Spain, and Portugal would all scream foul and demand their own cash / backstop.    Only if the bailout includes draconian spending cuts and severe punishment for failure would it actually solve the problem.  Considering we are talking about Greece which has a 200 year history of reneging on its debt the odds drop by quite a bit of a sucessful workout.

Even if you could get the Greeks to promise to spending cuts, would they follow through with it?  The Germans (presumed donor) could agree to purchase Greek debt ONLY AFTER they cut their budget each and every year until the have a balanced budget.  No balanced budget, no more debt buys by Germany.  Perhaps the Germans could attach a percentage of  EU funds flowing to Greece as their payment source? 

Even better, take the title to a few Greek Islands as collateral.  Don't pay up, you get an island (or 20 or so) 


There's some great commentary afterwards at zerohedge on this debate. Go on over and check it out. 


ht Zerohedge

Monday, February 8, 2010

Fast Money needs to do their homework -- High lumber prices are due to a temporary supply shortage not demand

I was watching Fast Money on CNBC tonight and their Prop Desk blurb on lumber and by implication Plum Creek (PCL) caught my attention.  The Fast Money speaker posited lumber prices had risen dramatically and this was a sign of a lumber and housing recovery.


I recently listened to the Plum Creek earnings report and management specifically commented upon weather conditions in the southeast US creating supply problems.  To quote from a SeekingAlpha article:


A lot of this lumber is filling inventories; it is concern over wet weather. As we mentioned, lot of these mills especially in the southern United States are very short inventory, and therefore there is not a lot of lumber inventory in the system.


I was down in Mississippi, Louisiana, and Arkansas last week, and what my guess is that half the forests are inoperable, and I don’t what it was like two months ago. I know they got some 9 inches of rain in one day. It’s a severe problem, and most areas you can’t operate in today. They need two or three or four weeks of dry weather so that we can get into a lot of these areas. That’s why inventories are so tight in that region. So it’s a huge issue.

Furthermore quite a few directors and officers of Plum Creek sold some of their holdings a few days after the earnings report:

CROWE BARBARA L 591

JIRSA ROBERT J 224

TUCKER DANIEL L 251

HOLLEY RICK R 4,376

BROWN DAVID A. 611

HOBBS JOHN B 178

LINDQUIST THOMAS M 2,097

RICKLEFS HENRY K 582

Wilson Nancy L 254

KRAFT JAMES A 604

LAMBERT DAVID W 1,076

KILBERG JAMES A 1,275

NEILSON LARRY D 776

REED THOMAS M 655

FITZMAURICE JOAN K 624
For a total of 14,174 shares.  No one purchased shares, all were sales. (Source)

I'm not disparaging Plum Creek or their officers / managers for selling off a small portion of their shares, but doesn't the comment about a short term weather phenomenon spiking lumber prices and quite a few officers unanimously selling their shares cause you to reconsider the short term valuation of the company?

I have followed Plum Creek on and off for several years and right now have a very small (just one contract) short call spread position on the company.  It is a company I may very well own in the future if the price is right.  Right now I do not foresee a strong housing rebound and my position is due to valuation issues. The price of both lumber and PCL have already had their run in my opinion.

My beef is with Fast Money.  Do your homework.  PCL may continue upwards for a little longer but it is riding high on a short term phenomenon.  The price rise is due to weather and a short term supply disruption. Once the forests dry out they are going to cut cut cut and the relatively high prices of lumber will come crashing down.

p. s. I would not call lumber futures a 'secret sauce' unconventional indicator. It is a publicly traded futures contract available on stockcharts.com and everywhere else.  The implication you are revealing your sekrets is vaguely insulting.

Video from Russian Forum -- Various hedge fund managers discuss the world

A video from the recent Russian Forum.  It's an hour+ but I suggest you watch it all.

http://2010.therussiaforum.com/news/session-video3/

Numerous topics are covered including, coal, energy, Russia, China, US Treasuries, Emerging versus Developed economies.  Includes Hugh Hendry, one of my favorite money managers.

ht Zerohedge

Wednesday, February 3, 2010

The "Lets beat up on China some more" post

I've been collecting some links and posts on China for a while and I thought I'd dump them all at once.   The title may sound odd but right now China collapsing seems to be the chatter throughout the blogosphere.

I am very certain they are going to run into some serious problems but I'm not quite convinced it is about to collapse REAL soon.  I have been waffling on this for some time as to when to sell of my final holdings China related and start shorting (where I can)  My previous post on copper lays out a rather negative position but I really need to see some slowdown in Chinese lending year over year as well as some other concrete data points before I declare the China bubble is popping and go full bore.

Maybe the PIIGS issue in Europe will be the catalyst?  Dunno.  This is whats hard about investing. 

Chanos talk on China
http://www.ritholtz.com/blog/2010/02/chanos-sees-overheating-and-overindulgence-in-china/

Previous Chanos interview on China
http://www.cnbc.com/id/35056774/site/14081545

Vitaliy Katsenelson
http://contrarianedge.com/2010/01/28/chinese-quest-for-shortcut-to-greatness/

http://www.businessweek.com/magazine/content/10_02/b4162030091917.htm

Patrick Chovanec is a treasure trove of all things China with some excellent analysis and further links to follow.  Just read it all
http://chovanec.wordpress.com/

The obligitory video of an empty mall in China
http://video.iptv.org/video/1218530801

http://ftalphaville.ft.com/blog/2009/12/14/111176/china-the-heat-is-on/

Read this report.  It's mind blowing how much of their GDP comes from raw investment.  Yes, you can have too much.
http://www.pivotcapital.com/reports/Chinas_Investment_Boom_the_Great_Leap_into_the_Unknown.pdf

http://www.pekingduck.org/2009/12/chinas-asset-bubble/

Tuesday, February 2, 2010

Copper crossing the Rubicon. 90 days before copper Armageddon.


(edit 03/09/11) I have come out with a new article updating my bearish points on Copper


As I have mentioned before, copper inventory fundamentals support neither the current price nor the medium term price momentum.

In this somewhat longer post I'll lay out the case of how copper's fate will be decided within the next 90 days.

Inventories
The first chart shows recent inventory numbers for copper.  Since the 4th quarter of 2009 inventories have steadily risen with only one week of net declines. During that time inventories have consistently climbed at an average of at least 1,600 metric tons a day.

Looking back, inventories peaked at ~ 548,000 tons at the LME during the height of the financial panic in February 2009.  As of Friday, Jan 29, 2010 541,050 tons were sitting in the LME warehouses.  Throughout the world total copper inventories have surpassed their 2009 peak.


Longer term whenever copper inventories got up to the levels we are seeing today copper prices were usually in the sub $1 dollar range versus the 3.00+ price we are seeing right now.  (ht Wildebeests)


Technicals
Copper prices have dropped since the beginning of the year and has recently touched the 100 day moving average line.  Unless there is a massive upsurge in the price of copper over the next few days it is likely the 20 day moving average will cross over the 50.  I am hoping for a good solid bounce off this correction to initiate some short positions.


Seasonally copper is strongest during the first quarter of the year.  I'm speculating this is due to industrial concerns ordering copper in anticipation of the needs for the coming year.  (ht Spectrum Commodities)   If copper inventories continue to build throughout the first quarter 2010, when the seasonal boost ends we could see a very nasty fall in the price of copper.

Supply
As I have mentioned in previous posts all major copper mines appear to be up and running with no strikes or work stoppages.  Only one BHP mine in Australia is running at reduced capacity and it is scheduled to return to full capacity by March 31,2010 (source)

Demand
Even the International Copper Study Group shows excess supply and low demand. 
http://www.icsg.org/images/stories/pdfs/presrels_2010_01.pdf

In the first 10 months of 2009, world usage is estimated to have decreased by 1% compared with that in the same period of 2008.  Chinese apparent usage, which accounted for 40 % of world usage over this period, grew by 1.8 Mt (43%) and nearly offset an 18% decline in the rest of the world.* Usage in the EU-15 countries, Japan, and the United States, which combined accounted for about  29.5% of world usage, decreased by 21%, 31%, and 21%, respectively.
Re read that quote.  Copper usage increased by 43% in China but declined dramatically in the industrialized world.  If China had not gone on its lending bender copper usage would be in the toilet.  Even with the dramatic demand increase in China copper inventories still went up.

Previous posts here have revealed my opinion of the bubble forming in China.  Tightening monetary conditions in China will not help short term copper demand.

The counter argument
I am watching copper inventories on a daily basis now waiting for an entry point to initiate my short positions.  If copper inventories suddenly started going down instead of almost daily marching higher I would have to reconsider this thesis of a coming copper collapse.  I do not consider current monetary policy by any of the major powers stimulative enough to counteract the current inventory overhang from  either a demand creation or  montary inflation perspective.

Weapon of Choice
So how do you trade this?  For long only accounts you can try BOS.  It is an ETN which tracks the daily inverse price of copper, aluminum, and zinc.  Considering the high correlations of the three metals and the similar inventory situations it may be the best long way to trade this. There are some double inverse material etf's out there but I try to avoid the 2x leveraged etfs.  The decay rate is too dramatic and chews into your returns too quickly.

If you can / are willing to short there are multiple ways to play this.  Shorting FCX, PCU, TCK are some of the obvious methods, but shorting the country etfs of Australia (EWA), Chile (ECH), and Peru (EPU) would provide strong materials stock exposure.  If commodity prices tank all three countries will experience severe financial distress.

Please look at http://www.debtdeflation.com/blogs/  for some data on how Australia's debt loads are setting it up for a financial crisis similiar to what America just experienced.  Only the ravenous demand for raw materials by China kept it from experiencing a severe decline.  If commodity prices drop Australia is toast.

I have not completed all of my studies on any of the companies or countries enough to recommend you short them.  I am merely providing them as some ideas for further study by you.

Disclosure: As I don't know your financial situation, propensity for risk, tax situation, liquidity needs, or anything else about your financial situation this strategy may or may not be suitable for you.  I am laying out an aggressive strategy that can backfire if what I foresee does not come about.  Don't come crying to me if it doesn't work out. If it does, just give me credit and 2 and 20 :)   I am currently neither long nor short any of the securities mentioned above but intend to purchase or short some or all of them in the near future.

Additional Reading

http://agmetalminer.com/2009/12/08/copper-which-way-next/

http://www.zerohedge.com/article/global-tactical-asset-allocation-commodities

http://www.zerohedge.com/article/copper-new-precious-metal

http://seekingalpha.com/article/185619-base-metals-correction-start-of-a-crash-or-a-bear-trap?source=commenter  -- He has several good charts on how the commercial traders are also very short at this time.

(edit 03/09/11) I have come out with a new article updating my bearish points on Copper
http://merrillovermatter.blogspot.com/2011/03/this-is-not-copper-you-are-looking-for.html

Monday, February 1, 2010

Mortgage Delinquencies -- A real hockey stick graph

Mortgage delinquencies keep rising nationwide as reported by Freddie Mac & Fannie Mae (via Calculatedrisk blog)

Until the delinquency rate starts to fall I seriously doubt home prices or new home construction will do anything beyond stumble along.

One hidden benefit from all the loans going bad is pre payment speeds have sped up for various mortgage backed securities.  I have noticed a bump in principal paydowns beyond normal and I think its all the mortgages being purchased out of pools by the GSE's.  Considering I own a wad of leveraged inverse floaters at below par I'm happy with that.

Friday, January 29, 2010

Temporary Workers -- less worse

I know I know, I'm a bit late in producing this but I've been busy the last few weeks and the usual charts and graphs data feed has fallen to the wayside a bit.

Employment data came out a while ago and the temporary employment subsection showed some improvement in the famous 'second derivative' department. 

Unlike some other people who look at seasonally adjusted data I prefer to look at the non seasonally adjusted series, noise and all. 

December was higher than November, which is unusual.  It could be later hiring for the Christmas rush or the census hiring hitting.  As such the yoy% change was a bit higher than I expected.

 I have added a new line to the graph 'min max average'.  This line is constructed by averaging the max point over the last 14 months and  the minimum data point over the last 14 months.  I use 14 months because the peak and valley for temporary employment can each sometimes vary by a month.  Generally this min max average and the %yoy change confirm each others movements but I thought looking at the data a slightly different way would be interesting.  The min max average continues to drop.

Census hiring is supposed to peak during the summer months and thus hopefully not screw up this data series too much.  Right now it is showing a 'less worse' situation but still NO growth. 

Tuesday, January 26, 2010

"Fear the Boom and Bust" a Hayek vs. Keynes Rap Anthem -- Economists in a modern world

This has been making the rounds and is actually pretty funny... :)


Hippity Hop and Economics; you see them together all the time, right? :)

ht: zerohedge

Monday, January 25, 2010

Inflation expectations in the Treasury market


Relative to nominal treasuries, TIPS were a raging buy at the beginning of 2009 (I bought some then for income clients) Since then the ratio has begun to close in on its apparant long term average around 2.50 (eyeball average)

Note how steady the implied breakeven rate has been since ~2003 excepting the crisis of late 2008 - early 2009.   With the current great debate raging between the inflationists and deflationists it is interesting to now how much this indicator has not moved, and is actually returning to a long run average. 

Wednesday, January 20, 2010

End Date Bond ETF's -- A long time coming and a welcome addition

edit: I have a followup post to end date etf's here

Finally.  This is an ETF I've personally asked ETF complexes to create.  My prayers have finally been answered.  Ishares has come out with the first end date ETF series.

A quick explanation:  Until Ishares created the end date ETF's, all bond funds were perpetual.  If you purchased an etf with a target maturity the fund would always be purchasing and selling bonds within the target maturity band, credity quality criteria, etc.  If interest rates went up or down your fund value would go up and down accordingly but you'd never be sure how much your ETF would be worth in X number of years.

The end date ETF is different, the ETF is designed to expire at a specific date in the future.  From a financial planning perspective this is huge. Now you can build a 'bond ladder' with just a few purchases. With an end date ETF as the the expiration date approaches the volatility will decline as the duration decreases.

Buying muni bonds has always been a pain with huge spreads and taking lots of time to execute.  With the end date ETF's making adjustments will be very easy and quick and if you need to make minor changes in the future the spreads will be much tighter than buying and selling individual bonds.

One caveat, I would not buy them now. The premium to NAV is huge right now at more than 1.5%  The funds are also very small and the spreads are pretty wide.  Once the premium to NAV falls to fair value I will be a buyer of these funds for my clients and myself.

I can see why they created end date ETF's for the muni bond complex first as it is the most illiquid of the bond sectors. Hopefully they will be very successful and Ishares goes on to create end date ETF's for corporate, treasury, and TIP bonds.

Additional reading:
Investment News
Ishares.com end date 2017  ETF

Monday, January 18, 2010

Betting markets are predicting a win for Brown in Massachusetts -- What does this mean?


The betting site intrade.com shows Scott Brown leading in the special election for the vacant Senate seat in Massachusetts.  (The image is a static picture and does not show the current odds, click on the link above to get a current number)

While there has been much talk regarding this being the '60th Senate vote that will stop health care' I believe more attention should be paid to the House.  Health care passed by the slimmist of margins in the House and Mr. Brown's strong showing in a very Blue State most likely has quite a number of  Democratic House members quaking in fear. 

It does not matter if Brown wins now, even a close defeat may be enough to scare some House members into not voting for the health care bill.

Politics is not my strong suite and I'll try to avoid discussing it as much as possible.  This event just struck me as interesting due to the predictions markets opinion and the ramifications of one Senate vote.  Please no hate mail regarding one party being better than another.   I prefer neither party and hold my nose when I vote.

Tuesday, January 12, 2010

China raises reserve ratios, increases short term interest rates

The tightening has begun in China, just a few days after my previous post on bubbling lending growth in China.

Jan 11, 2010:  China raises reserve ratio by 0.5%.  (WSJ) This may not seem like a big idea, but by reducing the percentage of deposits available for lending you automatically slows down the pace of lending growth.  The more I think about this, the more I prefer it to just raising short term interest rates (which they also did a few days ago as well) which can hamper currency exchange rates and encourage carry trade lending.   Considering China's relatively undeveloped financial markets this method works better than if it was tried in America.

We'll see if this is just public posturing to put people on notice or really a reduction in the growth of lending shortly.  Watch this space. I'll keep you informed.


ht: Calculated Risk

Monday, January 11, 2010

Copper update: supplies going up and demand is ????

Some recent news on the copper fundamentals. 

A major strike at Codelco's mine lasted but a few days before the large bonus offered by management was accepted (Reuters, 2010 Jan 6)

Vale is restaring the Sudbury smelter which produces nickel and some copper. I don't have stats on how much copper it produces each day but the mine has been out of production since July.  It sounds like this strike will last a while and Vale is willing to bring in replacement workers.   (Reuters, 2010 Jan 7)

Note, from my research I believe the Vale / Sudbury mine is the ONLY copper mine out of action due to a strike. 

BHP's Olympic Dam slowdown due to equipment failure is due to be back up to full capacity by March 31,2010. Full capacity is estimated at ~600 / tons day. (BHP, 2009 October 8)  (BHP, 2009 November 6)  (Wikipedia)

All other major copper mines in the world appear to be running.  If you know of any that are not I'd appreciate an email.

Longer term, the Antamina mine recently won approval for expansion  (BHP, 2010 Jan 5)

On the demand side it is always difficult to know precisely, but copper inventories continue to rise.  The first quarter of the year is seasonally a strong time for copper prices.  I'll post more on the dynamics as I see it soon(tm)

Wednesday, January 6, 2010

The smell of lending bubbles in China. Do you like butter on your popcorn?


One item which is becoming a pet peeve of mine is the practice of writing articles making predictions with no underlying factual data to buttress their conclusions.  If you are going to predict something, at least tell me why! 

A current hot topic is China and whether it is in a bubble.  And if in a bubble, what kind?  Well, here's some juicy data and anecdotal evidence for you to chew on.

If you notice, lending in China skyrocketed last year.  As of November 30, 2009, total loans outstanding are up nearly 35% year over year.  That is a huge increase in the rate of growth.  

I would put to you that all that money sloshing around did not just end up in solidly performing loans made with proper underwriting standards with the full expectation they will be paid back. 

Sharp eyed readers may notice the decline in lending growth from October 07 to the nadir of November 08 coincides with the dramatic decline in the Chinese equity markets almost perfectly.  Once the lending spigots were turned back on the Chinese markets reversed course and charged back up again. 

I have previously mentioned my suspicions that some of that lending deluge has also made its way into the commodity markets as pure speculation, but I'll leave that to a later entry.

The hedge fund manager Jim Chanos has also noticed this excess credit creation.  Around time point 4:15 he starts to discuss China and their excessive lending.


When will this bubble pop? Can't tell you that. Keeping the pace of lending up at 35+% yoy may be a challenge for the Chinese government this year as the banks are running out of spare capital. There's already a lot of talk and some action trying to tamp down the speculative fires in property prices.  Where and when this all goes poof  is subject to speculation.  If it ends in 2010 it will punch a serious hole in the current world-recovery-buy-commodities-and-all-risky-assets theme. Its a dangerous game to play right now as prices can go parabolic before they go splat but I'm watching and waiting. 

Sit back and get your popcorn. The show will be very interesting to watch in 2010.

Monday, January 4, 2010

An example of how not to negotiate

Negotiation is an art and sometimes the battle is won or lost before discussions even begin.  The recent Copenhagen negotations on climate matters provides an excellent example.

From the Guardian, a journalist claims the Chinese wrecked the climate deal (2009, December 22)
A few choice words from a very interesting article:

.. But I saw Obama fighting desperately to salvage a deal, and the Chinese delegate saying "no", over and over again . . .
 . . . What I saw was profoundly shocking. The Chinese premier, Wen Jinbao, did not deign to attend the meetings personally, instead sending a second-tier official in the country's foreign ministry to sit opposite Obama himself. The diplomatic snub was obvious and brutal, as was the practical implication: several times during the session, the world's most powerful heads of state were forced to wait around as the Chinese delegate went off to make telephone calls to his "superiors". . .

 . . . So how did China manage to pull off this coup? First, it was in an extremely strong negotiating position. China didn't need a deal. . . .

. . . This does not mean China is not serious about global warming. It is strong in both the wind and solar industries. But China's growth, and growing global political and economic dominance, is based largely on cheap coal. China knows it is becoming an uncontested superpower; indeed its newfound muscular confidence was on striking display in Copenhagen. Its coal-based economy doubles every decade, and its power increases commensurately. Its leadership will not alter this magic formula unless they absolutely have to. . .
The bit in red  is the most critical. The Chinese didn't need a deal but they knew President Obama and other western leaders were desperate for one and they knew this. 

Always have a BATNA -- A Best Alternative To a Negotiated Agreement (I forgot where I read this, if you know, please let me know, I need to re read the book) .   If you cannot conceive of an alternative to the deal or contract you will negotiate poorly. Your opponent will most likely sense your situation as well and push you harder.  If you aren't willing to walk away from a deal your probabilities of not getting a good deal go up dramatically. 

Energy costs are a very important factor in numerous industries and the Chinese know this.  Why in their minds should they negotiate away this advantage? The Chinese suceeded in making President Obama and leaders of the rest of the Western world look foolish which will color future negotiations.  A very successful trip for the Chinese.

Philip Verleger on Oil, Natural gas, the Saudi perspecitve and more

A 30+ minute podcast of Philip Verleger interviewed on Bloomberg Radio.  (click the little play button next to the date)  A good overview of the oil, natural gas markets, the Saudis, and more.  He touches on the current use of tankers for oil storage, Exxon's purchase of  XTO, trade balances and the Chinese.

I have been following Mr. Verleger for a while and it is refreshing to hear an analyst say he was wrong.  Predicting the future prices of assets is always very tricky but he at least admits it.  He does reinforce that the inbalances causing him to predict low oil prices in 2009 are still there and do not appear to be abating.