I've mentioned Jim Chanos before in this blog, and he's out again with some telling examples of late stage 'exuberance'
While Mr. Chanos is almost never perfectly timed with the market's current mood, he is rarely wrong longer term.
http://www.bloomberg.com/news/videos/2016-06-15/chanos-easier-to-find-short-ideas-as-bull-market-goes-on
Wednesday, June 22, 2016
Monday, May 2, 2016
Cool tool - IBorrow shows you short stock availability and borrow rates
While reading one of the many blogs I follow I ran across this cool tool which I'd like to share with you:
https://www.iborrowdesk.com/
Interactive Brokers provides data showing borrow availability and the rate you'll pay to borrow the stock. Using this data however is a bit clunky. Fortunately IBorrow has come along allowing one to quickly pull up and visualize the data.

ht: Glenn Chan
https://www.iborrowdesk.com/
Interactive Brokers provides data showing borrow availability and the rate you'll pay to borrow the stock. Using this data however is a bit clunky. Fortunately IBorrow has come along allowing one to quickly pull up and visualize the data.

For those looking at option strategies, which broad based etf's to short, or other strategies, knowing the quantity and rate of shares available can be important. I suggest you give it a try.
ht: Glenn Chan
Friday, April 29, 2016
Never bet against The Chanos
Never bet against The Chanos
That may sound like an odd commandment, but it's a good one. I speak of Jim Chanos, the well known short seller. Speaking highly of a member of such a profession may raise the hackles of some individuals, as well as governments, but I have been following his public pronouncements for quite a while and he may be early, but very rarely wrong. Post the great recession of 2008-2009 he was one of the first to warn about the construction & credit bubbles percolating in China; and while ridiculed for it his warnings have played out.
I even have a google alert on "Jim Chanos" (along with quite a few others) so as to catch everything he talks about. Recently I got a hit on a great 90+ minute podcast he did with FT Alphaville.
Podcast: Jim Chanos on the art of short-selling
I suggest you listen to all of it.
Monday, April 18, 2016
Hugh Hendry talking macro and China
It's been a while since I've mentioned Hugh Hendry but he's popped back up on YouTube recently. After his positively raucous returns in the depth of the crisis he had a long period of very underwhelming returns and from his manner in this broadcast I'd guess a tough few years.
ft.com describes the decline in assets under management in 2014
As always I find him entertaining to watch. He provides some of the reasons for his reversal of opinion on China as well. Regardless whether you agree with him or not I suggest you listen.
source: http://www.macrobusiness.com.au/2016/04/hugh-hendrys-long-dark-night-of-the-soul/
Wednesday, March 9, 2016
US Coal - brutal fallout from low natural gas prices
I've recently posted on the drop in natural gas and oil prices, but I haven't commented much on the knock on effects. A brutal example is the destruction of coal companies in the US. Train car loadings of coal have completely fallen off a cliff, caught fire, and remain a smouldering ruin.

Look at some of the stock symbols for coal companies and you'll see declines even more severe. Here's BTU (Peabody Energy)

Low natural gas prices are encouraging a switch from coal to natural gas electricity generation


Look at some of the stock symbols for coal companies and you'll see declines even more severe. Here's BTU (Peabody Energy)

Low natural gas prices are encouraging a switch from coal to natural gas electricity generation
It is not a good time to be in the coal business
disclosure: No positions, either long or short.
Friday, March 4, 2016
Free delayed quotes and a plethora of other financial data
If you are looking to import quotes into an excel spreadsheet, I haven't found anything else as convenient or extensive. It can take you a while to get up to speed on the data available but it is worth it. The range of data available, for free, is mind boggling.
Here's just a sample of the data available from the Yahoo feed:
| Basic Quote | Fundamentals | Technicals | Estimates | Real-Time (ECN) | |||||
| Code | Description | Code | Description | Code | Description | Code | Description | Code | Description |
| s | Symbol | j1 | Market Capitalization | a2 | Average Daily Volume | t8 | 1yr Target Price | k1 | Last Trade (ECN with Time) |
| n | Name | f6 | Float Shares | t7 | Ticker Trend | e9 | EPS Est. Next Quarter | b3 | Bid (ECN) |
| p | Previous Close | r5 | PEG Ratio | j | 52-week Low | e7 | EPS Est. Current Yr | b2 | Ask (ECN) |
| o | Open | p5 | Price/Sales | j5 | Change From 52-week Low | e8 | EPS Est. Next Year | c6 | Change (ECN) |
| h | High | p6 | Price/Book | j6 | Pct Chg From 52-week Low | r6 | Price/EPS Est. Current Yr | w4 | Day's Value Change (ECN) |
| g | Low | b4 | Book Value | k | 52-week High | r7 | Price/EPS Est. Next Yr | c8 | After Hours Change (ECN) |
| x | Exchange | r | P/E Ratio | k4 | Change From 52-week High | j3 | Market Cap (ECN) | ||
| l1 | Last Trade (Price Only) | e | Earnings/Share | k5 | Pct Chg From 52-week High | r2 | P/E (ECN) | ||
| l | Last Trade (With Time) | j4 | EBITDA | m3 | 50-day Moving Avg | k2 | Change & Percent (ECN) | ||
| d1 | Date of Last Trade | s7 | Short Ratio | m7 | Change From 50-day Moving Avg | v7 | Holdings Value (ECN) | ||
| t1 | Time of Last Trade | d | Dividend/Share | m8 | Pct Chg From 50-day Moving Avg | g5 | Holdings Gain & Percent (ECN) | ||
| k3 | Last Trade Size | y | Dividend Yield | m4 | 200-day Moving Avg | g6 | Holdings Gain (ECN) | ||
| c1 | Change | r1 | Dividend Pay Date | m5 | Change From 200-day Moving Avg | m2 | Day's Range (ECN) | ||
| p2 | Percent Change | q | Ex-Dividend Date | m6 | Pct Chg From 200-day Moving Avg | i5 | Order Book (ECN) | ||
| c | Change & Percent | ||||||||
| v | Volume | Option Quote Additions | |||||||
| m | Day's Range | Code | Description | ||||||
| j | 52-week Low | o1 | Open interest? | ||||||
| k | 52-week High | p3 | Type of option | ||||||
| w | 52-week Range | e3 | Expiration date | ||||||
| b | Bid | s3 | Strike price | ||||||
| b6 | Bid Size | n | Name of option | ||||||
| a | Ask | ||||||||
| a5 | Ask Size | ||||||||
note, the last trade quote is l1 (lowercase 'L' then the number '1') (that drove me nuts for a while)
here's how it looks in my spreadsheet =RCHGetYahooQuotes(+Z2,"l1")
This is only one small segment of the data, The full excel list of all the data points available can be found here: http://ogres-crypt.com/SMF/Elements/ and it is a truly phenominal amount of data. Yes, some of it is repetitive but if you are looking for data on a security, start here.
There's also an active message board if you have any questions on implementation:
Of course you can get one cell to refer to another, so one can populate quite a bit of data in a spreadsheet by just entering the symbol. Best part is it's all free.
I use the plug-in almost daily and would honestly be lost without it. I suggest you give it a try as well.
Wednesday, March 2, 2016
Oil's eventual recovery, part two
Before continuing with my posts on oil and energy I'd like to call out two excellent sources of information. I've used both in my research and while I attempt to source everything sometimes bits of it slips through into the zeitgeist of my ideas and isn't directly referenced.
http://soberlook.com/ and more specifically his Daily shot email list is an excellent publication on the current financial markets. He is also on twitter at @SoberLook
John Kemp is an energy market journalist at Reuters. He also provides frequent emails specifically on the energy markets. Email him at john.kemp@thomsonreuters.com and request to be added to his email list. He is also on twitter at @JKempEnergy
Ok, back to it....
In my earlier communication I discussed some possible reasons why oil prices dropped so dramatically. Now we'll consider why they will rise, eventually. I'll keep this one 'bullish' and save the horrifically bearish counterpoints for the next installment.
There's a common pithy statement which is the theme of this post -- The solution for low prices is low prices
Low prices encourages demand
The economy has not roared back to life in the last 12 months but the pain at the pump sure has gone down. Lower prices are encouraging people to drive more.

Low prices destroys investment in new supply
Energy extraction is a very capital intensive business and the decline in prices has already reduced investment, either voluntarily or involuntarily
This chart is very instructive in showing how investment (like drilling, see below) in the energy business chases the price.
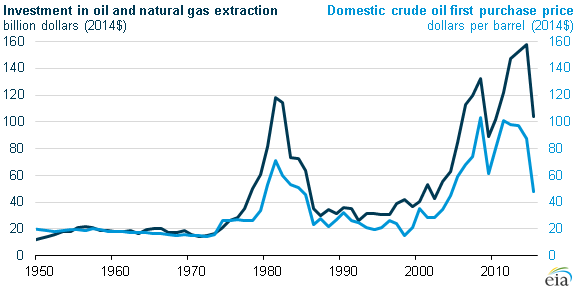
As much as 400,000 barrels a day of oil production is at risk as U.S. shale companies like Samson Resources Co. run out of money and are forced to slow drilling.
Natural decline in fields
Conventional fields decline around 5% a year; shale fields drop much faster, 50%+ the first year, with the rate of decline lower in later years. Assuming just a 5% decline rate in oil production from current oil fields you need to replace the entire oil production of Canada each year. Yes, there is excess capacity now and new projects coming online, but the dropoff in new field investments will eventually overwhelm that spare capacity.
Drilling rig count continues to plummet, not only in the US but worldwide
New wells require new drilling, and new drilling activity is plummeting. As of October 2015, the year over year percentage decline is a stunning 42% Current data as of 02/8/16 shows this trend continues:

Comparing drilling rig activity and oil prices one can see how drilling activity 'chases' the oil price. Higher oil prices increases drilling activity and vice versa.

thanks to: @MaxCRoser
One must be careful thinking this means a 42% reduction in wells dug or initial flow rate. Drilling rigs have become frightfully effective over the last few years in US / Canada. A recent email from RBN energy provides examples of this stunning increases in total productivity.

These improvements are at Moore's law level of technology gains in the energy sector. A 428% gain in initial production productivity over four years is stunning. This massive increase in efficiency is something I'll come back to in the next missive.
Political Chaos
Harder to predict but considering the number of countries derive a high percentage of their GDP or federal budget from oil / natural gas revenues, something is bound to break at these prices.

Please click around on the link above and observe how many countries depend upon petroleum products for a very large portion of their revenue, and right now they are hurting! Some have a massive kitty to draw upon but the rest, not so much.
Here's a quick rundown of a few countries hit by the drop in oil prices.
Venezuela - a horrid situation made worse by the drop in petroleum prices. In my opinion it will be the first domino to fall
Econimic basket case - http://www.bbc.com/news/world-latin-america-34983467
Change in government - http://www.bbc.com/news/world-latin-america-35043945
Economic collapse - https://www.washingtonpost.com/news/wonk/wp/2016/01/29/venezuela-is-on-the-brink-of-a-complete-collapse/
Brazil
Recession - http://www.economist.com/news/americas/21665038-shrinking-once-vibrant-economy-shocking-ordinary-folk-well
Russia
Recession - http://www.wsj.com/articles/world-bank-downgrades-russias-economic-outlook-1443609118
Saudi Arabia
The Saudi's are running out of money.

At a burn rate approaching 100 billion dollars a year they do have a couple of years breathing room, but what about the other OPEC nations? The House of Saud is considering selling bonds to plug the gap, but this only buys them time.
While some of the OPEC nations can handle low oil prices for years the majority cannot

Source: The Daily Shot
(Future) Loss of Power
This may be a bit abstract but work with me here for a bit. It may be causing fiscal and political problems at home but right now OPEC, and Saudi Arabia specifically are crushing their competitors and destroying future production prospects in other countries. There just aren't enough projects to make up for the 5+% percent a year decline in the world's oil wells.
Right now the best estimate is OPEC has ~2 million barrels/day of spare capacity.

Saudi Arabia is the largest OPEC producer and has historically provided quite a bit of swing capacity to modulate the price of oil (see above link for additional details) What happens if perchance OPEC succeeds and is able to completely demolish the US shale business as well as other non-OPEC production and they are running flat out producing oil?
Do they now 'control' the price of oil? NO. They are just like every producer out there, maximizing production. So I ask you in my hypothetical situation: How low would the next president of the United States bow to the king of Saudi Arabia? Without spare capacity Saudi Arabia loses a very important lever of power. In some ways this is analogous to a quote from Dune.
Will Saudi Arabia declare victory, reduce production, and regain the ability to raise and lower the price at will?
War
Yemen
The war in Yemen doesn't get as much attention as it should
Syria, Isis, Turkey, Russia, the Kurds, etc
I can't even keep up with all the various sides and their motivations. It's a big fat nasty cruel mess. However, with all the ordnance flying around it could trigger something much much worse and blow up an oil field or two.

The geopolitical struggles of Russia, Iran, and Saudi Arabia are being played out in the energy markets as well on the battlefield. How, when, or if they will eventually set aside enough of their differences to agree to a cut in production is something I cannot predict, but the inevitable decline in current production will inexorably reduce the excess supply in the markets.
Next I'll try to list some of the factors as to why there's so much bearishness in the oil markets today; add it all up and there's not a pleasant looking horizon for oil producers.
Subscribe to:
Posts (Atom)