Wednesday, March 2, 2016

Oil's eventual recovery, part two

Before continuing with my posts on oil and energy I'd like to call out two excellent sources of information.  I've used both in my research and while I attempt to source everything sometimes bits of it slips through into the zeitgeist of my ideas and isn't directly referenced.  

http://soberlook.com/ and more specifically his Daily shot email list is an excellent publication on the current financial markets.  He is also on twitter at @SoberLook

John Kemp is an energy market journalist at Reuters.  He also provides frequent emails specifically on the energy markets.  Email him at john.kemp@thomsonreuters.com and request to be added to his email list.  He is also on twitter at @JKempEnergy  

Ok, back to it....


In my earlier communication I discussed some possible reasons why oil prices dropped so dramatically.  Now we'll consider why they will rise, eventually.   I'll keep this one 'bullish' and save the horrifically bearish counterpoints for the next installment.

There's a common pithy statement which is the theme of this post -- The solution for low prices is low prices

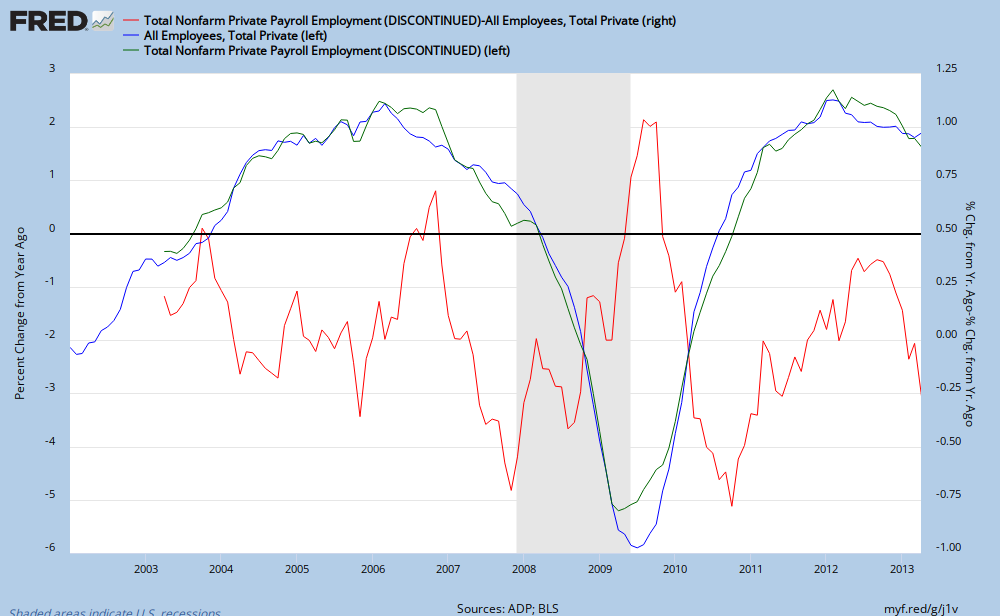
Low prices encourages demand
The economy has not roared back to life in the last 12 months but the pain at the pump sure has gone down.  Lower prices are encouraging people to drive more.
(thanks to @mbusigin - link)

Low prices destroys investment in new supply


Energy extraction is a very capital intensive business and the decline in prices has already reduced investment, either voluntarily or involuntarily

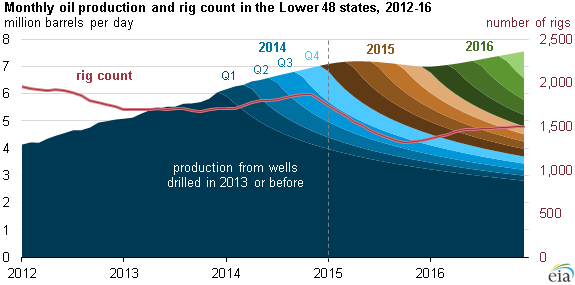
This chart is very instructive in showing how investment  (like drilling, see below) in the energy business chases the price. 


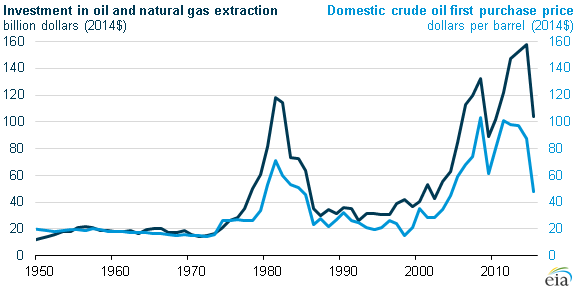
As much as 400,000 barrels a day of oil production is at risk as U.S. shale companies like Samson Resources Co. run out of money and are forced to slow drilling.


Natural decline in fields
Conventional fields decline around 5% a year; shale fields drop much faster, 50%+ the first year, with the rate of decline lower in later years.  Assuming just a 5% decline rate in oil production from current oil fields you need to replace the entire oil production of Canada each year.  Yes, there is excess capacity now and new projects coming online, but the dropoff in new field investments will eventually overwhelm that spare capacity.


Drilling rig count continues to plummet, not only in the US but worldwide

New wells require new drilling, and new drilling activity is plummeting.  As of October 2015, the year over year percentage decline is a stunning 42%  Current data as of 02/8/16 shows this trend continues:


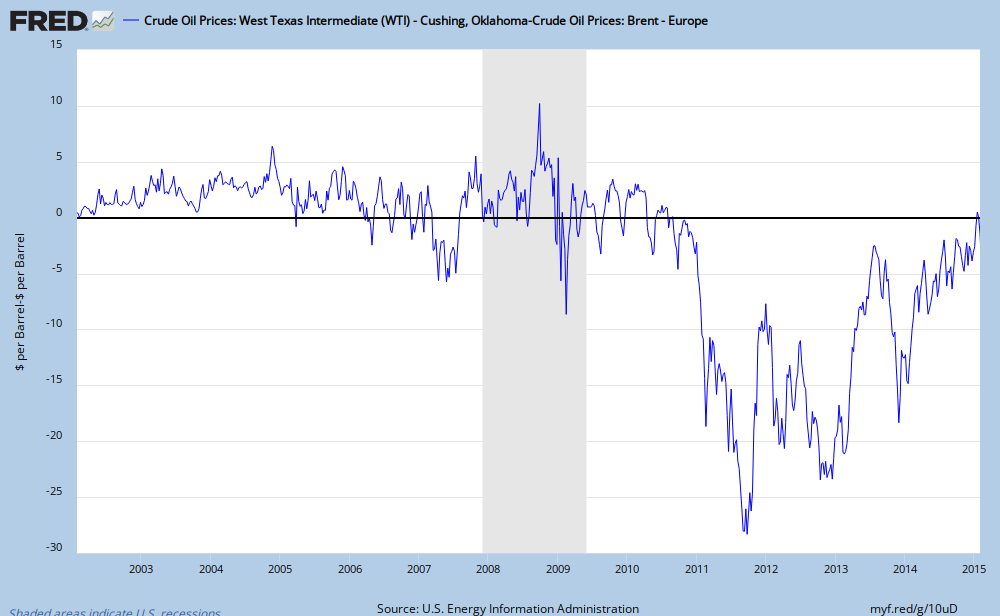
Comparing drilling rig activity and oil prices one can see how drilling activity 'chases' the oil price.  Higher oil prices increases drilling activity and vice versa.
thanks to: @MaxCRoser
One must be careful thinking this means a 42% reduction in wells dug or initial flow rate. Drilling rigs have become frightfully effective over the last few years in US / Canada. A recent email from RBN energy provides examples of this stunning increases in total productivity.


These improvements are at Moore's law level of technology gains in the energy sector.  A 428% gain in initial production productivity over four years is stunning.  This massive increase in efficiency is something I'll come back to in the next missive.


Political Chaos
Harder to predict but considering the number of countries derive a high percentage of their GDP or federal budget from oil / natural gas revenues, something is bound to break at these prices.


Please click around on the link above and observe how many countries depend upon petroleum products for a very large portion of their revenue, and right now they are hurting!  Some have a massive kitty to draw upon but the rest, not so much.

Here's a quick rundown of a few countries hit by the drop in oil prices.

Venezuela - a horrid situation made worse by the drop in petroleum prices. In my opinion it will be the first domino to fall


Brazil
Recession - http://www.economist.com/news/americas/21665038-shrinking-once-vibrant-economy-shocking-ordinary-folk-well

Russia
Recession -  http://www.wsj.com/articles/world-bank-downgrades-russias-economic-outlook-1443609118

Saudi Arabia

The Saudi's are running out of money.  
At a burn rate approaching 100 billion dollars a year they do have a couple of years breathing room, but what about the other OPEC nations?  The House of Saud is considering selling bonds to plug the gap, but this only buys them time.


While some of the OPEC nations can handle low oil prices for years the majority cannot
 
Source: The Daily Shot


(Future) Loss of Power
This may be a bit abstract but work with me here for a bit. It may be causing fiscal and political problems at home but right now OPEC, and Saudi Arabia specifically are crushing their competitors and destroying future production prospects in other countries.   There just aren't enough projects to make up for the 5+% percent a year decline in the world's oil wells.  

Right now the best estimate is OPEC has ~2 million barrels/day of spare capacity.  

Saudi Arabia is the largest OPEC producer and has historically provided quite a bit of swing capacity to modulate the price of oil (see above link for additional details)  What happens if perchance OPEC succeeds and is able to completely demolish the US shale business as well as other non-OPEC production and they are running flat out producing oil?

Do they now 'control' the price of oil? NO. They are just like every producer out there, maximizing production.  So I ask you in my hypothetical situation: How low would the next president of the United States bow to the king of Saudi Arabia?   Without spare capacity Saudi Arabia loses a very important lever of power.  In some ways this is analogous to a quote from Dune.


Will Saudi Arabia declare victory, reduce production, and regain the ability to raise and lower the price at will?


War

Yemen
The war in Yemen doesn't get as much attention as it should


Syria, Isis, Turkey, Russia, the Kurds, etc
I can't even keep up with all the various sides and their motivations.  It's a big fat nasty cruel mess.   However, with all the ordnance flying around it could trigger something much much worse and blow up an oil field or two.

 
The geopolitical struggles of Russia, Iran, and Saudi Arabia are being played out in the energy markets as well on the battlefield.  How, when, or if they will eventually set aside enough of their differences to agree to a cut in production is something I cannot predict, but the inevitable decline in current production will inexorably reduce the excess supply in the markets.  


Next I'll try to list some of the factors as to why there's so much bearishness in the oil markets today; add it all up and there's not a pleasant looking horizon for oil producers.

Monday, November 16, 2015

Oil's eventual recovery, part one

Right now we are experiencing something which has only happened twice in nearly 30 years, a greater than 50% year over year drop in the price of oil.  The previous event happened during the great financial panic of 2008 - 2009.  Today the US, China, or Western Europe aren't experiencing a severe recession, so what triggered this dramatic fall?  At it's simplest, supply exceeded demand.  The how and why is fascinating. 

Some quick charts describing the extent of the decline
Year over year percentage change in the price of oil.
Absolute price - Beside the dip to 40 during the great financial crisis, the last time US oil prices flirted with 40 dollars was in 2004.


So what caused the fall?  Note the graph below, showing oil production levels of the largest five producers up to 2014.   US oil production grew 15.9% from 2014 to 2013 (Source: BP statistical review) and not only was this the largest percentage increase in the world, it was also from one of the largest suppliers in the world.  In fact in 2014 the United States pumped more oil than any other country in the entire world. From a nadir in 2005, US production rose nearly 70% by 2014 -- a increase of more than 4.7 million barrels a day.  Additionally total world oil production increased by ~2.3% in 2014.


Demand did not keep pace with supply however. 


Source: yardeni.com

Note the graph above hasn't shown a decline in world crude oil demand since the great recession; instead supply outstripped demand and prices fell.  Saudi Arabia exacerbated the situation by pumping even more oil. (I'll speculate as to WHY later)
Saudi Oil Production

Remember all that talk about Peak Oil so many years ago?  American oil companies evidently didn't read the articles calling for the death of oil production. 
    
Source: Google Trends

The internet keeps track of almost everything now, so make your predictions carefully.


Even the New York Times piled onto this theme; stating Malthus was eventually right and we'd better get used to it (Peak Oil)

While I may appear to be picking on these predictions, and I am (a little) I would rather highlight how hard it is to make predictions, especially long term forecasts.  I will make a few in later missives.  Be careful with those. 


So how did the US reverse the inevitable decline in oil production?  A technique called fracking (aka shale oil or tight oil) altered the cost structure and timing of extracting oil and natural gas from locations previously thought to be uneconomic.  

Below is a quick video and some additional links describing the technique:


Fracking can resonate for some of my readers as an especially dangerous form of petroleum extraction.  The linked video is from an oil company, so they will show the process in a positive light without discussing any of the possible downsides. (Such as waste fluids intruding into water aquifers)  Google any of the terms and you'll find a strident debate regarding the safety of this new technique.   

Regardless of the safety of the process or whether it should be employed at all, fracking and tight oil extraction techniques are currently legal in America and from my reading of the current regulatory climate will remain so.  Even a recent EPA report on fracking provides fodder for both sides:  https://rbnenergy.com/cmon-gimme-good-water-epa-draft-report-on-hydraulic-fracturing  

Fracking allows for the extraction of oil and natural gas from areas previously thought uneconomic.  New wells are  drilled very quickly and productivity in drilling speed and initial flow rates continue to rise.  Specific examples are always illustrative.  (source: http://www.eia.gov/petroleum/drilling/pdf/dpr-full.pdf )


Notice on the upper left image how initial oil flows increased from less than 100 barrels a day to ~800 barrels in the Eagle Ford region (Texas), a greater than x8 increase in productivity!  This has catapulted Eagle Ford production to more than 1.2 million barrels a DAY. On its own the Eagle Ford today would be considered one of the top 20 countries in the world for oil production from nearly nothing in 2010.  Scroll through the linked report above and you'll see comparable increases in both natural gas and oil for other regions of the country.

One can also see the quick drop off in production for both oil and natural gas since the collapse in energy prices.  The rapid decline rate (more on that later) from these new techniques is both a blessing and a curse The game has changed, and OPEC knows it.

This new technology (fracking) has disrupted the oil production regime, creating a new potential avenue of supply not only in America, but the rest of the world.    How this new technology changes energy pricing as well as geopolitics is too much for just one post.  I'll try to dissect the situation later.

Thursday, February 12, 2015

More energy posts


Another dump of energy articles, questions, etc.

Will big oil charge ahead while smaller E&P's face liquidity issues?
http://on.wsj.com/1KsPoya via @liamdenning
The huge energy companies may be able to power through this downfall assuming prices start rising and they can swoop in and gobble up some low priced assets in the wake of the collapse.

Productivity improvements in oil and nat gas production have been very impressive over the last few years so looking at rig counts over a long time period have lost their efficacy.

https://rbnenergy.com/getting-better-all-the-time-productivity-improvements-crude-production-and-moores-law 

Great post on the recent improvements

World versus US oil prices
http://research.stlouisfed.org/fred2/graph/?g=10uD


For a while US (WTI) prices separated quite dramatically from world prices (BRENT) Will this recur in the future?  The spread helped US refiners earn outsized profits.

Will the Keystone pipeline ever get built?
http://seattletimes.com/html/nationworld/2025244144_pipelineeconomicsxml.html

We may see instead a pipeline going east / west in Canada.  The oil must flow!
http://bigstory.ap.org/article/canada-oks-oil-pipeline-pacific-coast

Crude oil shipped via rail has exploded over the last few years.  Will this trend continue?
https://www.aar.org/data-center/rail-traffic-data


Did oil shipments crowd out coal shipments? And will the coal finally get to the power plants?


Another article on floating storage


Thursday, February 5, 2015

Some Questions regarding oil, nat gas, and energy in general


Some questions have been floating about in my head after the great fall in oil prices and their rippling through all the other various forms of energy.  The predictions are few, if any, just a lot of thinking out loud and links. I've been collecting all this in too many separate nooks and crannies and it is time to collate and collect my thoughts and links.

It's not pretty but it gets the data posted an in one spot.  Questions are just questions, don't look for subtext. Hopefully there will be more than one post.

Will re fracking now become more of a thing?  With lower rigs costs and already built in infrastructure will the older fracked fields get a makeover?

http://climateerinvest.blogspot.com/2015/01/oil-its-cheaper-to-refrack-slb-hal-wft.html

Consumers will gain from lower oil prices yet industries related to oil production, distribution, transportation will suffer.  Which will adjust faster? Concentrated pain versus diffused benefit and over what timeframe?

Jim Chanos has some interesting commentary regarding the tension between big oil's economics versus the frackers.

http://www.cnbc.com/id/102343976


Major trading houses are taking advantage of the contango in oil to store it now in supertankers and sell it forward, or perhaps just speculate?  Either way inventories are going up

http://www.wsj.com/articles/worlds-largest-traders-use-offshore-supertankers-to-store-oil-1421689744

According to shipbrokers and analysts, major traders including Vitol SA, Gunvor SA, Trafigura Beheer BV and Koch Supply & Trading Co. Ltd have chartered supertankers capable of storing a combined total of more than 30 million barrels of oil—many of them in the past few weeks.
RBN Energy runs some numbers on the contango trade (02/02/15)
https://rbnenergy.com/skipping-the-crude-contango-the-floating-crude-storage-trade

eia.gov provides some production decline graphs to see what would happen if new production just stopped in the lower 48. My eyes say a falloff from 7 million / year to ~ 5 million by 2016
http://www.eia.gov/todayinenergy/detail.cfm?id=19711


Also discusses backlogs in production.  Would hate to have paid up for a well that's going to be cash flow negative right now ! :(

Global LNG prices converge, upper band crushed by drop in oil prices
http://www.reuters.com/article/2015/01/27/lng-prices-global-idUSL6N0V603620150127


Monday, November 24, 2014

Yet another empty Chinese city - New York version

Stumbled across another empty Chinese city, this one thanks to @TheCreditBubble and his blog post

He so kindly provided a video link showing the full scale of the project.  While some may claim there is progress and construction still going on, please compare the level of activity to the massive size of the project.


Here's a Google Maps screenshot of the place.  Just look at all those skyscrapers that need to be filled.


So what happens when all those skyscrapers go up, no one fills them, and the 'need' for more slows down? Iron ore prices fall back into the earth

ht @soberlook

Thursday, November 20, 2014

Weather and Energy - Hurricane free for another year

The continental US made it another year without a hurricane making landfall. (Winter snow storms are another matter!)

How many more years will the US extend this streak before we get slammed by another one? I have no idea, but it will eventually happen.

A lack of past volatility can lull people into a false sense of security and that's when one can lose quite a bit of money (and lives as well as property in this case)

Some are even opining (Washington Post, 2014 October 7) the recent lack of hurricanes creates a dangerous future situation, and there's some credence to that.

The catastrophic bond market is something I've examined over the years as an alternative asset class but haven't invested any capital in this area yet. We've been in a relatively benign environment and pricing for risk has dropped in this area (sound familiar?)  I'd rather wait for a some 'volatility' to re-enter the system before dipping my toe into this area.

http://www.preferredconcepts.com/when-worlds-collide/ examines this a little more

We've been recently lucky with hurricanes. This will eventually end.


Tuesday, September 16, 2014

ValueX Vail - A most excellent adventure

How I felt at times during the conference:
"Dude did he just tell us value guys to buy that expensive subscription based technology stock?
Yeah.  It kinda made sense."
This last June I had the pleasure of reconnecting with a most excellent group of people at the ValueX  Vail  conference hosted by Vitaliy Katsenelson

The conference does not consist of large rooms with speakers presenting their case to attendees who then shuffle off to another seminar. Instead the members present and later discuss their ideas amongst a much smaller audience and it is this interaction, defense, and intimacy (only 40 people) that initially drew me to attend last June and in 2012.

Presenting and defending your idea to a small crowd provides an opportunity for feedback and insight as to how others view the markets.   While the ideas are always interesting and varied I find it as valuable to try to discern how people think about the markets; short term flippers, deep value buyers, GARP, growth, distressed investors (and more) all have their own perspective and even within a value stock themed conference there are varied techniques and perspectives.

The profession of security analysis and selection can be something of a lonely, boring one. Staring at a computer screen for the majority of the day becomes tiresome -- getting the opportunity to actually chat with others who share the same passion is a rare pleasant opportunity for me.   I made it a point to spend time with newer attendees as well as some returning friends.  Trying to balance the goal of being a social butterfly with a desire to really converse in depth with folks was a challenge.

Skynet is becoming self aware, buy the right stocks!
While not all the presentations were released for public consumption you can find quite a few of them here:
http://www.scribd.com/VitaliyKatsenelson/documents
In both instances it was an excellent crowd with everyone having something to offer.  The 2012 conference gave me a new respect for Southerners.  As they are quiet, speak slowly and and with a funny accent (just kidding guys) they tend to be underestimated by us Northerners.   If a Southern investor comes up and says he just wants to leeaarrrn from you, Run, run fast. (thanks Alex Rubalcava

In 2014 I learned what to buy before Skynet becomes self aware and what to buy after China's infrastructure binge goes pop.  2014's session also included a very cordial opposing pair of presentations on why you should be long and short the same stock.   Showing both the bullish and bearish case for the same stock was a nice addition that I hope continues at Vail and is an excellent idea for other conferences.

Get Real

While this post praises the ValueX Vail conference it also is a suggestion to you - find others who share a passion to invest and actually talk, present, kibbitz, challenge each other.  Not everyone can or would want to attend next years' conference (actually, please don't, you may bump me out!)  but if you have an opportunity to join or create a group / conference nearby I would suggest you do so.

While today's technology allows for various methods of communication they don't yet completely replace the advantages of real human interaction. At ValueX Vail I learned just as much during casual conversation as during the organized presentations.   Until Sheldon dramatically improves his Virtual Presence Device, getting together in the same room is a lot more fun and productive.


Fortunately there are some opportunities.

A ValueX in Lennox, MA hosted by Vail attendee Ethan Berg is coming this fall.  More information can be found here:
http://www.winthropestate.com/#!valuex-berkshires/c1r9z
The window for applications is closing soon so please apply if interested.  Unfortunately my to-do list overextended enough already (it took 2+ months to finally post this entry!) otherwise I'd go.

@AlexRubalcava in Los Angeles hosts a monthly 10K 'book club' where people get together and dig into the financial documents of various companies.  I'm also gently prodding Alex to start up a ValueX LA, so if you are interested in attending one in LA please gently prod him to get that rolling. Thanks.

Finally, I myself am starting up a '10K book club' /  value investing discussion group for the Seattle / Tacoma area. If you are interested please leave a comment below or email me at:
merrillovermatter@gmail.com

While today's hyper connected world allows us the opportunity to virtually connect in a manner not even conceived of a generation ago, very low tech human conversations should still be a part of your continual discovery of the financial markets. I suggest you give it a try.

Wednesday, June 4, 2014

Natural gas has a very big hole to fill this summer

The Polar Vortex winter dramatically drew down natural gas stocks as the numerous cold fronts worked their way through America.  While a decline is natural gas inventories is expected each year, this year America ended the winter with dramatically less natural gas in inventory.


US Natural Gas inventories - via the US EIA http://ir.eia.gov/ngs/ngs.html

As of the most recent report, inventories are 40.1% below their 5 year average. To graphically show what this means going forward, here's an estimation of how much needs to be injected into storage every day until the maximum fill date date of November 11th.


The 2014 line is the one much higher than the rest.  Note how the 2012 line was the lowest, when we experienced extremely low prices.

While it's always a guess as to when we'll hit the maximum in storage each year, (going back 19 years the average date was November 11th with a standard deviation of 9.5 days)  it is quite apparent this year is unlike many others in recent history.  Injecting ~40% more each day looks like a challenge which will not be overcome.  Injection rates depend upon the increased production, weather, industrial activity, hurricanes, and I'm sure a few other factors I have forgotten.

 IF we get a nasty hurricane barreling through the gulf, a hot summer, or an early cold winter we could have some serious inventory problems in early 2015.

I am not attempting to estimate how much natural gas will be in the ground for this coming winter but it is something to watch this summer. 

Thursday, September 12, 2013

Peak Hurricane?

Atlantic hurricane frequency - source: NOAA
So far this year we have been blessed by a lack of hurricanes on the East Coast.  As the accompanying graphic shows, we are past peak hurricane season this year without any major storms.  Of course statistics only work with a large sample size. Hurricane Sandy from last year is an unfortunate contrary example.  She struck in the last few days of October and as you can see from the accompanying graph this is supposed to be rather uncommon.   This doesn't matter to someone whose home that was demolished by Sandy.


As of right now the coast does look rather clear except for one storm named Humberto near Africa.  The current forecast is for it to rise to hurricane force winds and then fall back to a tropical storm.  One can keep an eye on any storms forming at http://www.nhc.noaa.gov/  During hurricane season I open this window every day to see if anything is forming on the horizon.


Beyond the horrible damage, death and destruction a hurricane inflicts upon society they also play havoc with a portfolio.  Reinsurance firms, oil service companies, oil and natural gas exploration firms, and even utility companies are but a few of the sectors which can be adversely affected by one slamming into America.    Keep an eye out for upcoming storms and also consider stress testing your portfolio. If a major hurricane hit the East Coast how would it affect your portfolio?  Do all your energy stocks have Gulf of Mexico fields? What's the risk with your insurance firms, reinsurance firms?  

Disclosure: Own stock in pipeline companies, reinsurance, oil service, and major oil & nat gas companies

Edit: Reuters also notices the lack of meteorological violence this year 

Wednesday, September 11, 2013

The rising oil choke collar


Oil prices are on the upper end of the post 2008 financial crisis range. So far each time prices rose to the 110+ region they have backed down again.


Gasoline and Oil prices - source: Federal Reserve


While Syria has been getting all the news, Libya's declining oil production may be another reason for firm oil prices. A recent WSJ article (September 10, 2013) highlights the situation.   Considering the vast majority of Libya's GDP is derived from the energy sector (CIA Factbook) this does not bode well for the new post Gaddafi Libya.

I suggest keeping an eye on the price of oil. If it gets much higher it may temper the recent positive economic news.

Additional reading:
http://en.wikipedia.org/wiki/Economy_of_Libya
http://en.wikipedia.org/wiki/Libyan_civil_war

Disclosure: Own oil service, energy, and pipeline stocks

Friday, May 31, 2013

Divergence in employment growth numbers

A few months ago I highlighted how looking at the employment data on a year over year basis provides a different perspective on the numbers.  Today I'd like to bring up a divergence between the private and public data.

yoy employment data and divergence them

The green and blue lines are the ADP and government year over year employment growth data, left scale and the red jagged line is the difference between their growth rates, right scale.  What's noticeable is the divergence between them.  While it would be better to show just the absolute difference between them regardless of sign, I'm not enough of a FRED graph Meister to figure that out right now.   Right now the >0.35% difference between them is the largest on record for this data series.

Is this divergence truly exceptional? It may have been greater in the past and only later revisions tightened up the spread.

I'm not making a prediction as to which is wrong, merely it's likely the spread will narrow in the future.

Wednesday, May 22, 2013

Hugh Hendry watch - Turning Japanese

I'm a bit late in this, but here's the most recent report from Hugh Hendry's Eclectica fund.

It's a quick read so I won't excerpt from it except for one trading tidbit:  In 2008 he purchased a 10 year one touch call on the Nikkei with a 40,000 strike price !!!

Q1 Review 2013 Hendry by ValueWalk.com


ht: Mark H @fundmyfund

Thursday, May 16, 2013

Addition by subtraction -- Not all dividends are created equal

The current low bond yield, low growth environment has fostered a growing interest in high dividend yield paying stock. I myself have a separate account offering focused on this very area of the equity markets.  A number of ETF's have popped up as well over the last few years to accommodate this demand.

Some of these ETF's may not be the best designed and can show the downside of simplistic indexing. An excellent example of this is Pitney Bowes' recent dividend slashing.

For those of you unfamiliar with the company, they derive a vast majority of their revenue from helping companies snail mail packages and letters.  (Pitney Bowes presentation dated 02/12/13, page 6)  Since you are reading this post online I don't think much discussion is needed to expound upon the disruptive capabilities of the internet. The revenue chart below shows how they have fared.  I do imply anything nefarious with the company mind you, just they are stuck in a market segment that will most likely continue to experience challenges in the future.

They recently cut their dividend after several years of consistent dividend increases. The stock has not done well in the past few years.

When this company popped up on my screens for possible purchase it didn't take long for me to reject it.

As you can see from this chart from ycharts.com, revenue growth has been declining for years, even though dividends have been rising.

Pitney Bowes data - source: ycharts.com

Unfortunately there were a few dividend focused etf's which were sucked into buying the very high yield provided by the stock. Thanks to the site xtf.com we can see which etf's hold the stock

Etf's holding PBI - source xtf.com
Note: 20% of the free float of PBI is held in ETF's and the vast majority of the top ten etf holders were dividend focused.

Pitney Bowes shows just because a company has a high yield and a growing dividend you shouldn't just blindly purchase it.  Always do you homework and look at their long term history and prospects. A very high yield can be a sign of distress instead of opportunity.

Disclosure: Do not and never have held Pitney Bowes stock in my dividend focused separate accounts  or anywhere else.

Monday, April 1, 2013

Copper inventories swelling

I have discussed copper before and something recently caught my eye which deserves a followup post.  Copper inventories are rising rather dramatically.

Worldwide copper inventories and yearly change


As you can see from the chart above copper inventories are now at highs not seen since nearly 10 years ago.  More importantly the year over year change is quite positive as well.  The above graph is a month old but as we can see from a higher frequency chart total inventories may break 900 thousand tons soon.

Glocal Copper stocks - Source: Reuters
Copper pricing has been week recently as well and sits on a rough trendline going back to mid 2010.

Copper prices week - Source: Finviz.com


Why inventories are rising so quickly could be due to several forces, some of the top of my head are:

Rising production -- New mines coming online.

Declining demand -- A sluggish Europe could be assisting in keeping demand down.

Hidden inventory being brought back onto the markets -- If this is a case of Dark Copper coming back into the official warehouses it would validate some theories regarding base metals being used as financing source in China.  FT.com posts dated March 31, 2011  and April, 26 2012 provide good roundups of the possibility and mechanics.

Of course only hindsight knows why copper stocks are building right now. We have to wait to find out why.

Disclosure: Short Base Metals

Thursday, March 14, 2013

Jim Chanos is still short China - video

The video I previously posted has incited a new round of Chinese Empty City Watching.  Jim Chanos, the famous short seller, was recently on CNBC explaining his rationale and hinting at his short positions.


Link to video

How many more times China can continue down this path is unknown.

Monday, March 4, 2013

60 Minutes discovers the Chinese Housing Bubble

Last night 60 Minutes ran a piece on the housing bubble of China:


Link to video
I have written about the Chinese Housing Bubble at length and it is nice to see the popular media pick up on it as well.  I wonder how much longer this can go on.

Thursday, February 21, 2013

A warning from the unemployment line

The weekly initial claims for unemployment data was released today and it is getting close to being a concern of mine.

Year over year change, initial unemployed claims - Source Federal Reserve
As can be seen from this chart of *non seasonally adjusted and *4 week average of seasonally adjusted data, (the noisiest and smoothest interpretations of this data series) the rate of decline has effectively stopped. Yes there were some spikes upwards during the hurricane Sandy and blizzard Nemo, but the trend has started to move upwards after spending most of 2011 and 2012 fluctuating around an annual decline in jobs  unemployment claims of ~40,000.

We are now near the break-even mark and if it starts to consistently go positive, (more people laid off now as compared to last year) this would be a very strong warning flag to the US economy.

Considering the recent payroll tax hike and other tax increases recently imposed it is possible we may see this happen.

Thursday, January 3, 2013

Employment, seasonality, and noise

The monthly employment report can be a high volatility day for the markets.  The ADP report (BusinessInsider.com) came in above expectations and this was most likely the reason for early weakness in bond prices. (before the Fed Minutes release.)  However how one looks at the data can change your perspective.

Monthly employment numbers, ADP and Federal
Source: Federal Reserve
ADP data is shown in red, with Federal data shown in blue. Looking at the data, it does look quite random, great recession notwithstanding. It jerks up and down with no apparent order and the ADP data does not appear to track the Federal data well.  No wonder the markets can be volatile on employment release days.

Let us look at the data a slightly different way ...
Year over year change in employment, ADP and Federal
Source: Federal Reserve
Same data, just looking at a year over year percentage change instead of an absolute monthly change.  Looks a little different doesn't it?  There are minor variations in the two curves but not much.  Looking at the data this way however, it appears we are on the downslope of employment growth and that great ADP number which was released today doesn't look so impressive does it?

I'm not implying what tomorrow's employment report will look like, just a hint that how you look at the data can make a big difference in what conclusions to draw.