|
Right
now we are experiencing something which has only happened twice in nearly 30
years, a greater than 50% year over year drop in the price of oil. The previous
event happened during the great financial panic of 2008 - 2009. Today the US,
China, or Western Europe aren't experiencing a severe recession, so what
triggered this dramatic fall? At it's simplest, supply exceeded demand. The
how and why is fascinating.
Some quick charts describing the
extent of the decline
Year over year percentage change in the price of oil.

Absolute price - Beside
the dip to 40 during the great financial crisis, the last time US oil prices
flirted with 40 dollars was in 2004.

So
what caused the fall? Note the graph below,
showing oil production levels of the largest five producers up to 2014.
US oil production grew 15.9% from 2014 to
2013 (Source: BP statistical review) and not
only was this the largest percentage increase in the world, it was also from one
of the largest suppliers in the world. In fact in 2014 the United States pumped
more oil than any other country in the entire world. From a nadir in 2005, US production rose nearly 70% by
2014 -- a increase of more than 4.7 million barrels a day. Additionally total world oil production increased by
~2.3% in 2014.
 
Source: yardeni.com
Note
the graph above hasn't shown a decline in world crude oil demand since the great
recession; instead supply outstripped demand and prices fell. Saudi Arabia exacerbated the situation by
pumping even more oil. (I'll speculate as to WHY
later)
Saudi
Oil Production

source: moslereconomics.com
Remember all
that talk about Peak Oil so many years ago? American oil companies evidently
didn't read the articles calling for the death of oil production.

Source: Google
Trends
The internet keeps track of almost everything now, so make your
predictions carefully.
Even the New York Times
piled onto this theme; stating Malthus was eventually right and we'd better get
used to it (Peak Oil)
While
I may appear to be picking on these predictions, and I am (a little) I would
rather highlight how hard it is to make predictions, especially long term
forecasts. I will make a few in later missives. Be careful with
those.
So how did the US reverse the inevitable decline in
oil production? A technique called fracking (aka shale oil or tight oil)
altered the cost structure and timing of extracting oil and natural gas from
locations previously thought to be uneconomic.
Below
is a quick video and
some additional links describing the technique:
Fracking can resonate for some
of my readers as an especially dangerous form of petroleum extraction. The
linked video is from an oil company, so they will show the process in a positive
light without discussing any of the possible downsides. (Such as waste fluids
intruding into water aquifers) Google any of the terms and you'll find a
strident debate regarding the safety of this new technique.
Regardless of the safety of the process or whether it should
be employed at all, fracking and tight oil extraction techniques are currently
legal in America and from my reading of the current regulatory climate will
remain so. Even a recent EPA report on fracking provides fodder for both sides:
https://rbnenergy.com/cmon-gimme-good-water-epa-draft-report-on-hydraulic-fracturing
| ||
Fracking allows for the extraction of oil and natural gas
from areas previously thought uneconomic. New wells are drilled very quickly
and productivity in drilling speed and initial flow rates continue to rise.
Specific examples are always illustrative. (source: http://www.eia.gov/petroleum/drilling/pdf/dpr-full.pdf )  Notice on the upper left image how initial oil flows increased from less than 100 barrels a day to ~800 barrels in the Eagle Ford region (Texas), a greater than x8 increase in productivity! This has catapulted Eagle Ford production to more than 1.2 million barrels a DAY. On its own the Eagle Ford today would be considered one of the top 20 countries in the world for oil production from nearly nothing in 2010. Scroll through the linked report above and you'll see comparable increases in both natural gas and oil for other regions of the country. One can also see the quick drop off in production for both oil and natural gas since the collapse in energy prices. The rapid decline rate (more on that later) from these new techniques is both a blessing and a curse The game has changed, and OPEC knows it. This new technology (fracking) has disrupted the oil production regime, creating a new potential avenue of supply not only in America, but the rest of the world. How this new technology changes energy pricing as well as geopolitics is too much for just one post. I'll try to dissect the situation later. |
Monday, November 16, 2015
Oil's eventual recovery, part one
Thursday, February 12, 2015
More energy posts
Another dump of energy articles, questions, etc.
Will big oil charge ahead while smaller E&P's face liquidity issues?
http://on.wsj.com/1KsPoya via @liamdenning
The huge energy companies may be able to power through this downfall assuming prices start rising and they can swoop in and gobble up some low priced assets in the wake of the collapse.
Productivity improvements in oil and nat gas production have been very impressive over the last few years so looking at rig counts over a long time period have lost their efficacy.
https://rbnenergy.com/getting-better-all-the-time-productivity-improvements-crude-production-and-moores-law
Great post on the recent improvements
World versus US oil prices
http://research.stlouisfed.org/fred2/graph/?g=10uD
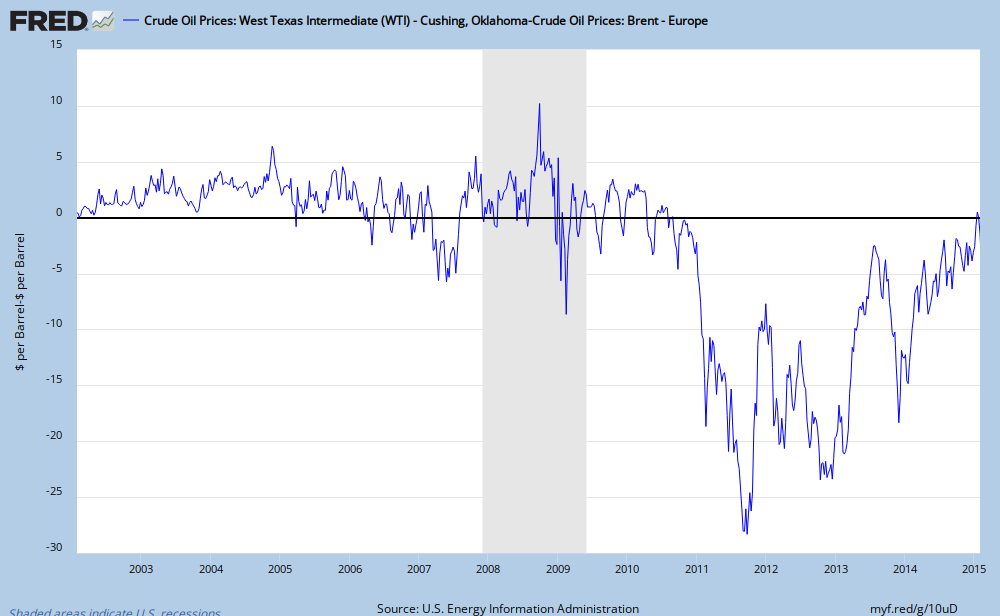
For a while US (WTI) prices separated quite dramatically from world prices (BRENT) Will this recur in the future? The spread helped US refiners earn outsized profits.
Will the Keystone pipeline ever get built?
http://seattletimes.com/html/nationworld/2025244144_pipelineeconomicsxml.html
We may see instead a pipeline going east / west in Canada. The oil must flow!
http://bigstory.ap.org/article/canada-oks-oil-pipeline-pacific-coast
Crude oil shipped via rail has exploded over the last few years. Will this trend continue?
https://www.aar.org/data-center/rail-traffic-data

Did oil shipments crowd out coal shipments? And will the coal finally get to the power plants?
Another article on floating storage
Thursday, February 5, 2015
Some Questions regarding oil, nat gas, and energy in general
Some questions have been floating about in my head after the great fall in oil prices and their rippling through all the other various forms of energy. The predictions are few, if any, just a lot of thinking out loud and links. I've been collecting all this in too many separate nooks and crannies and it is time to collate and collect my thoughts and links.
It's not pretty but it gets the data posted an in one spot. Questions are just questions, don't look for subtext. Hopefully there will be more than one post.
Will re fracking now become more of a thing? With lower rigs costs and already built in infrastructure will the older fracked fields get a makeover?
http://climateerinvest.blogspot.com/2015/01/oil-its-cheaper-to-refrack-slb-hal-wft.html
Consumers will gain from lower oil prices yet industries related to oil production, distribution, transportation will suffer. Which will adjust faster? Concentrated pain versus diffused benefit and over what timeframe?
Jim Chanos has some interesting commentary regarding the tension between big oil's economics versus the frackers.
http://www.cnbc.com/id/102343976
Major trading houses are taking advantage of the contango in oil to store it now in supertankers and sell it forward, or perhaps just speculate? Either way inventories are going up
http://www.wsj.com/articles/worlds-largest-traders-use-offshore-supertankers-to-store-oil-1421689744
According to shipbrokers and analysts, major traders including Vitol SA, Gunvor SA, Trafigura Beheer BV and Koch Supply & Trading Co. Ltd have chartered supertankers capable of storing a combined total of more than 30 million barrels of oil—many of them in the past few weeks.RBN Energy runs some numbers on the contango trade (02/02/15)
https://rbnenergy.com/skipping-the-crude-contango-the-floating-crude-storage-trade
eia.gov provides some production decline graphs to see what would happen if new production just stopped in the lower 48. My eyes say a falloff from 7 million / year to ~ 5 million by 2016
http://www.eia.gov/todayinenergy/detail.cfm?id=19711
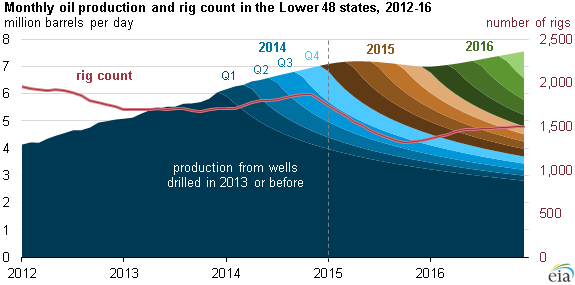
Also discusses backlogs in production. Would hate to have paid up for a well that's going to be cash flow negative right now ! :(
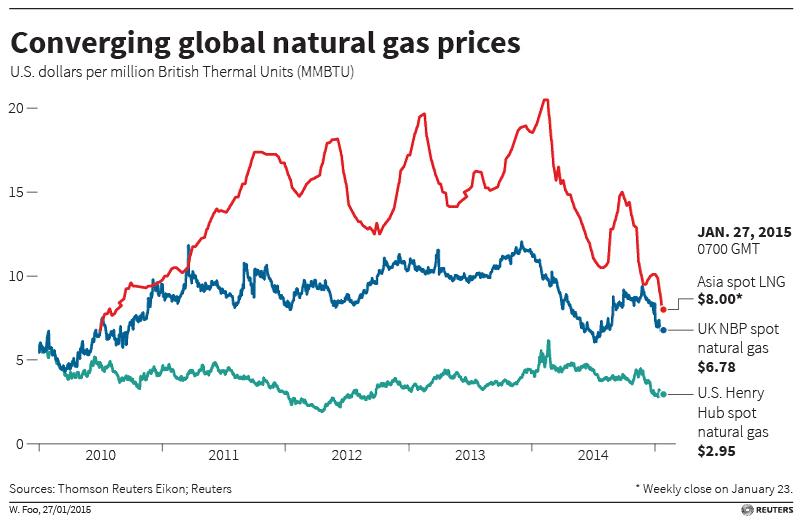
Global LNG prices converge, upper band crushed by drop in oil prices
http://www.reuters.com/article/2015/01/27/lng-prices-global-idUSL6N0V603620150127
Subscribe to:
Posts (Atom)