For those of you who aren't knee deep in the markets, you may not know about the HFT (high frequency trading by computers) and their affects on the markets. HFT was implicated in the May 'flash crash' and with the declining volume in the stock market it appears most trading is between computers. In that spirit I present a more humorous slant on the entire situation:
Here's the acoustic version:
http://www.youtube.com/watch?v=WGoi1MSGu64
And some news regading HFT systems getting fined (Zero Hedge)
Update: The Reformed broker has some new HFT toys for Christmas! :)
Thursday, September 16, 2010
Tuesday, September 7, 2010
Oil inventories creeping upwards

Looking at total US oil and petroleum products inventory levels you will see they are at 20 year peaks! The OECD is also above its 5 year average inventory levels.

* Emerging market demand and specifically China is a great unknown.
* The Iran / Israel situation is keeping people jumpy.
* The financialization of commodities also provides a firm bid on oil prices.
* Hurricane season is just warming up in the US. We'll see how much carnage they produce.

Here's some previous entries on the topic of hurricane season:
http://merrillovermatter.blogspot.com/2009/08/weather-and-oil.html
http://merrillovermatter.blogspot.com/2009/09/so-far-no-hurricanes-this-year.html
Monday, August 30, 2010
The Fed is exacerbating the move in bonds
The recent Federal Reserve August 10 announcement to reinvest principal paydowns from its very large (1+ Trillion) mortgage backed security portfolio into longer dated US Treasury securities is providing additional downward pressure on home loan rates.
 Because interest rates have dropped since the completion of purchases, (March 31,2010: Federal Reserve MBS Faq) the frequency of individual homeowners refinancing has gone up. As such cash flows back to the Federal Reserve have increase to a rate higher than initially expected.
If you look at the first chart attached you can see 10 year bond prices were already marching higher before the Federal Reserve reinvestment announcement of August 10. (Shown here as a white vertical line) Since then they have continued higher.
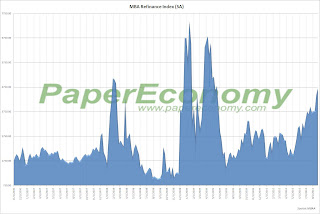 These principal payments are being invested in longer term Treasury Bonds which then pressures long term interest rates down, causing more refinancings, causing more cash to be sent to the Fed which then buys more Treasury bonds. Do you see the pattern here? This does not mean long bond yields WILL drop, but it places additional pressure for them to go down until the current refinancing burst (Paper Economy) ends.
I wonder if the Fed thought this all through?

If you look at the first chart attached you can see 10 year bond prices were already marching higher before the Federal Reserve reinvestment announcement of August 10. (Shown here as a white vertical line) Since then they have continued higher.

I wonder if the Fed thought this all through?
Wednesday, August 25, 2010
Refinance your home if you haven't done so already

The Wall Street Journal had a recent article about shopping for a home loan:
The interest rates for 30-year fixed-rate mortgages are in free fall, averaging just 4.44% on Aug. 12, according to Freddie Mac. Not only was that down from 5.07% in January, it was the lowest since Freddie began keeping records in 1970.As the article mentioned some very good deals can be found at smaller banks and credit unions. Our family's primary checking account is at a credit union and their excellent customer service and low fees are a stark contrast to the national chains.
But even better deals can be found at smaller banks and credit unions.
"I've found that my clients can get routinely better rates by heading to a more regional lender and forgoing the bigger lenders," says Sean Satkus, a real-estate agent in the Washington, D.C., area.
The differences can be stark. On average, the three biggest banks—Bank of America Corp., Wells Fargo & Co. and J.P. Morgan Chase & Co.—offer rates of 4.66% on 30-year fixed mortgages for home purchases, according to Bankrate.com. By contrast, St. Louis's Heartland Bank is offering a rate of 4.50%. Acacia Federal Savings Bank comes in at 4.25%. And Rockland Trust Co. in Boston is offering just 4.13%. (None of these offers include "points," or extra fees to secure lower rates.).
If you are in the position to refinance and have questions give me a ring and we can talk about some of the options / pitfalls when looking for a new mortgage.
Monday, August 23, 2010
Greek bond yields keep crawling higher

You can see the spike to 12+% and then rapid decline in May when the 750+ billion Euro bailout package was announced.
Since then rates have started climbing again. I wonder what will happen when rates climb above their pre-bailout levels?
Thursday, August 19, 2010
Seasonality and the Baltic Dry Index
I'm doing some research on other economic indicators showing seasonality for a later post. An article on the BDI (Baltic Dry Index) and how shipping rates show a seasonal tendency caught my eye.
 From the Financial Times:


It is with interest, therefore, that we note Icap’s latest monthly shipping report — which errs towards the notion that the move wasn’t necessarily so unusual.As you can see from the graph from Stockcharts the BDI can be ... volatile.
According to the broker, for example, the BDI has fallen in June on 20 separate occasions since 1985 — making the recent declines relatively consistent.
As they noted:
..no other month can claim to have such a poor track record, although the month of July has shown a similar tendency towards weakness over the years.

It's important to know if a data series contains seasonal affects to it. That's one reason I tend to show data on a year over year format which eliminates time of year influences.
Wednesday, August 18, 2010
Money Money Supply -- Money supply update.
 A money supply update. The data presented includes both the M2 money supply and the only remnant of M3 still published by the Federal Reserve which is Institutional Money Market Funds. Together this is the 'broadest' measure of money supply published by the Federal Reserve.
As you can see money supply continues contracting which has not happened for the entire data series starting back in 1974. The previous slowdowns around 1994 and 2005 did show declining growth rates but this absolute decline on a year over year basis is unique.
The Fed needs to take some lessons on how to make money:
Subscribe to:
Posts (Atom)